
Disclaimer: The opinions expressed by our writers are their own and do not represent the views of U.Today. The financial and market information provided on U.Today is intended for informational purposes only. U.Today is not liable for any financial losses incurred while trading cryptocurrencies. Conduct your own research by contacting financial experts before making any investment decisions. We believe that all content is accurate as of the date of publication, but certain offers mentioned may no longer be available.
While the crypto market is going through a strong correction phase, numerous indicators are suggesting that the bottom might already be in.
Ichimoku cloud
Ichimoku cloud is one of the most widely used cryptocurrency indicators on the market that reflects both the support and resistance zones and determines the current trend on the market. While the daily chart of Bitcoin suggests that the first cryptocurrency is in a poor state, the situation on the weekly chart is different.
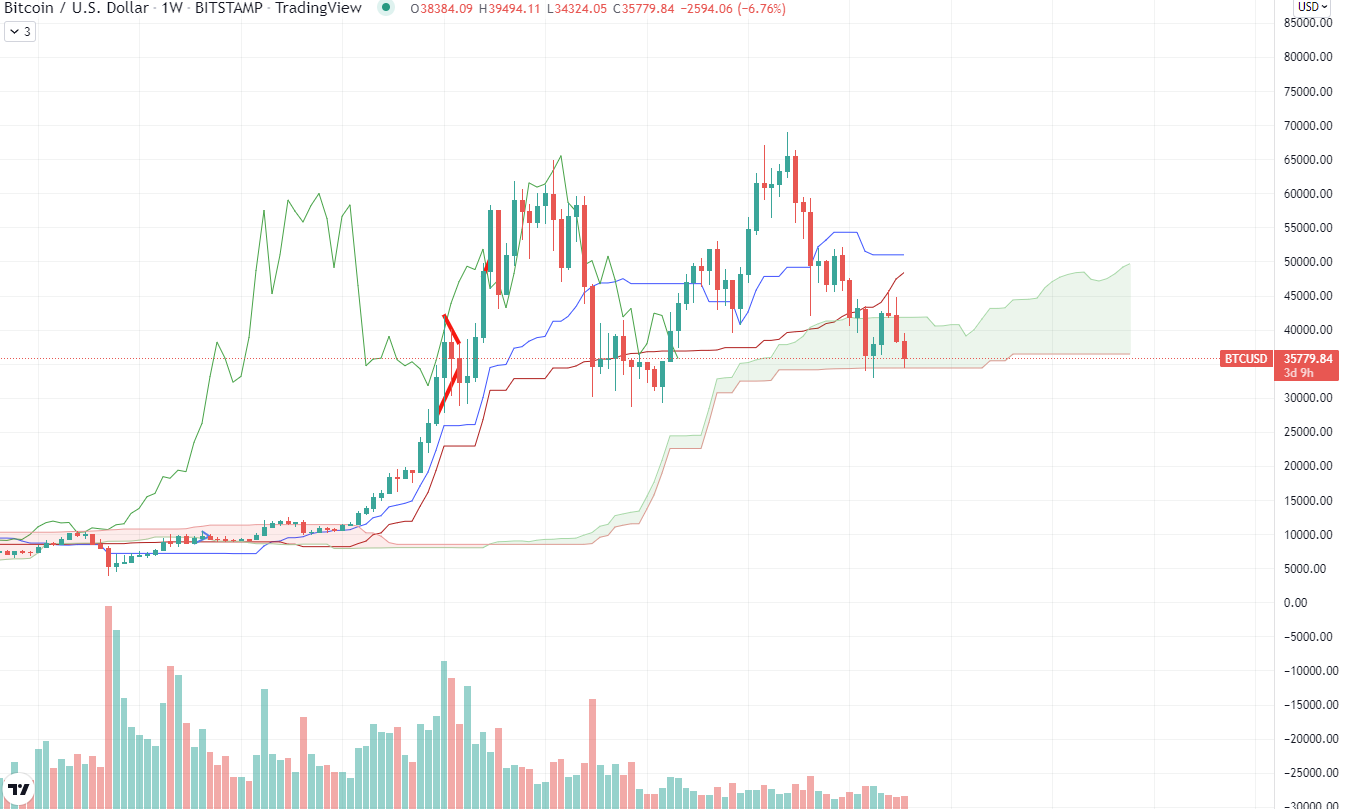
According to the situation on the weekly chart, Bitcoin is currently trading at the bottom of the Ichimoku cloud, which often acts as a strong support zone. The most recent Bitcoin bounce took place on Jan. 24, when the price reached the mentioned support.
Local Bitcoin bottom
While technical indicators could be a great way to determine points of resistance or changes in the trend, the previous price action of the asset could give us a hint about the future movements of the digital gold.

According to the past's price movements, Bitcoin has consolidated and bounced from $34,800, which could be considered the bottom for a current correction rally.
100-week moving average
While moving averages with periods of 50 and 200 candles are being used far more often than the 100-candled moving average, it could still act as a strong support and resistance point.
According to the weekly Bitcoin chart, the 100-week moving average is currently acting as a support for the price. Since the moving average also correlates with the Ichimoku cloud's support zone, Bitcoin may start consolidating in the $34,000-$36,000 zone.
 Dan Burgin
 U.Today Editorial Team