For decades, traders have been using terminals to get an edge on the market. Terminals can provide the latest market news, price action with charting, and other data to help traders in the age of information receive the most accurate information. When it comes to the world of TradFi, many terminals dominate the market, with the Bloomberg Terminal leading the pack. This resource isn’t often cheap, with the base plan for the Bloomberg Terminal running traders a whopping $24k per year. Would it contain the data you need even if you had the money for the terminal?

If you’re an active crypto trader, the answer is no. Crypto traders need on-chain data at their fingertips in an instant. Whether it be volume, liquidity or top token holders needed for analysis, one terminal has you covered - DexGuru.
But how can DexGuru help?
Charting
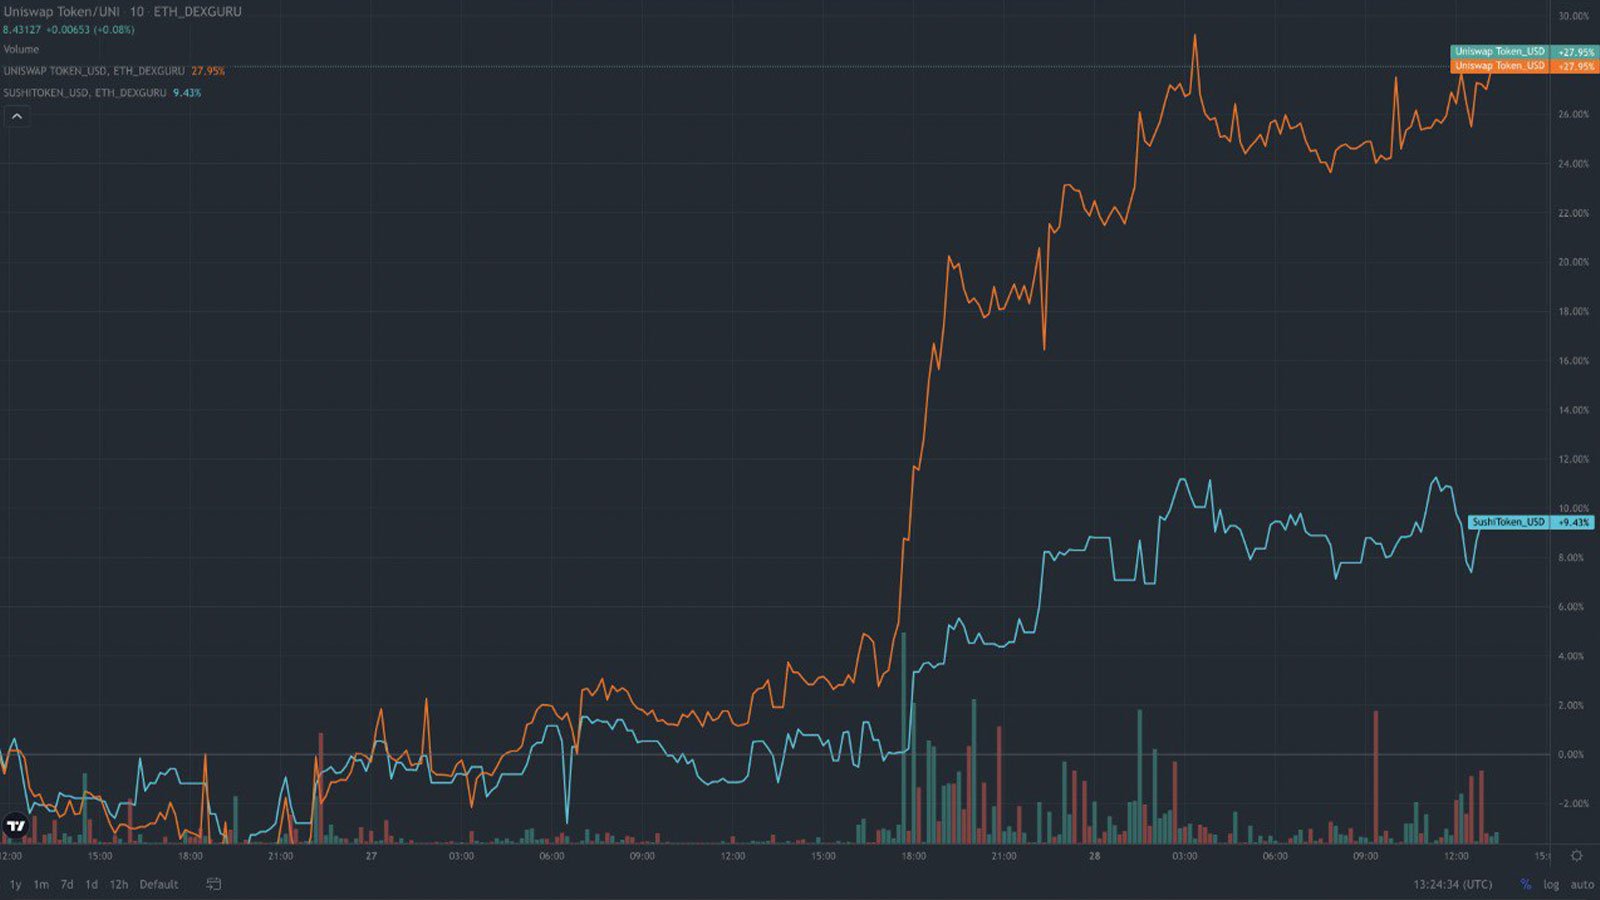
DexGuru offers top-of-the-line charting tools with their TradingView implementation. View your favourite assets priced over time with any indicators you may need. Often it can be helpful to plot multiple prices on the same graph, especially if they are competing products. Are you wondering whether to enter a trade using $SUSHI or $UNI? No worries, DexGuru lets you overlay the two charts so you can make a more informed decision.

Specific traders love to watch many different charts at once, with some having insane six-monitor setups to never miss a beat in the market! This can benefit traders using technical analysis who are always hunting for the next entry point. With the DexGuru multi-chart tool, these users can view up to nine charts simultaneously! Which nine tokens would you choose to follow every beat?
Liquidity
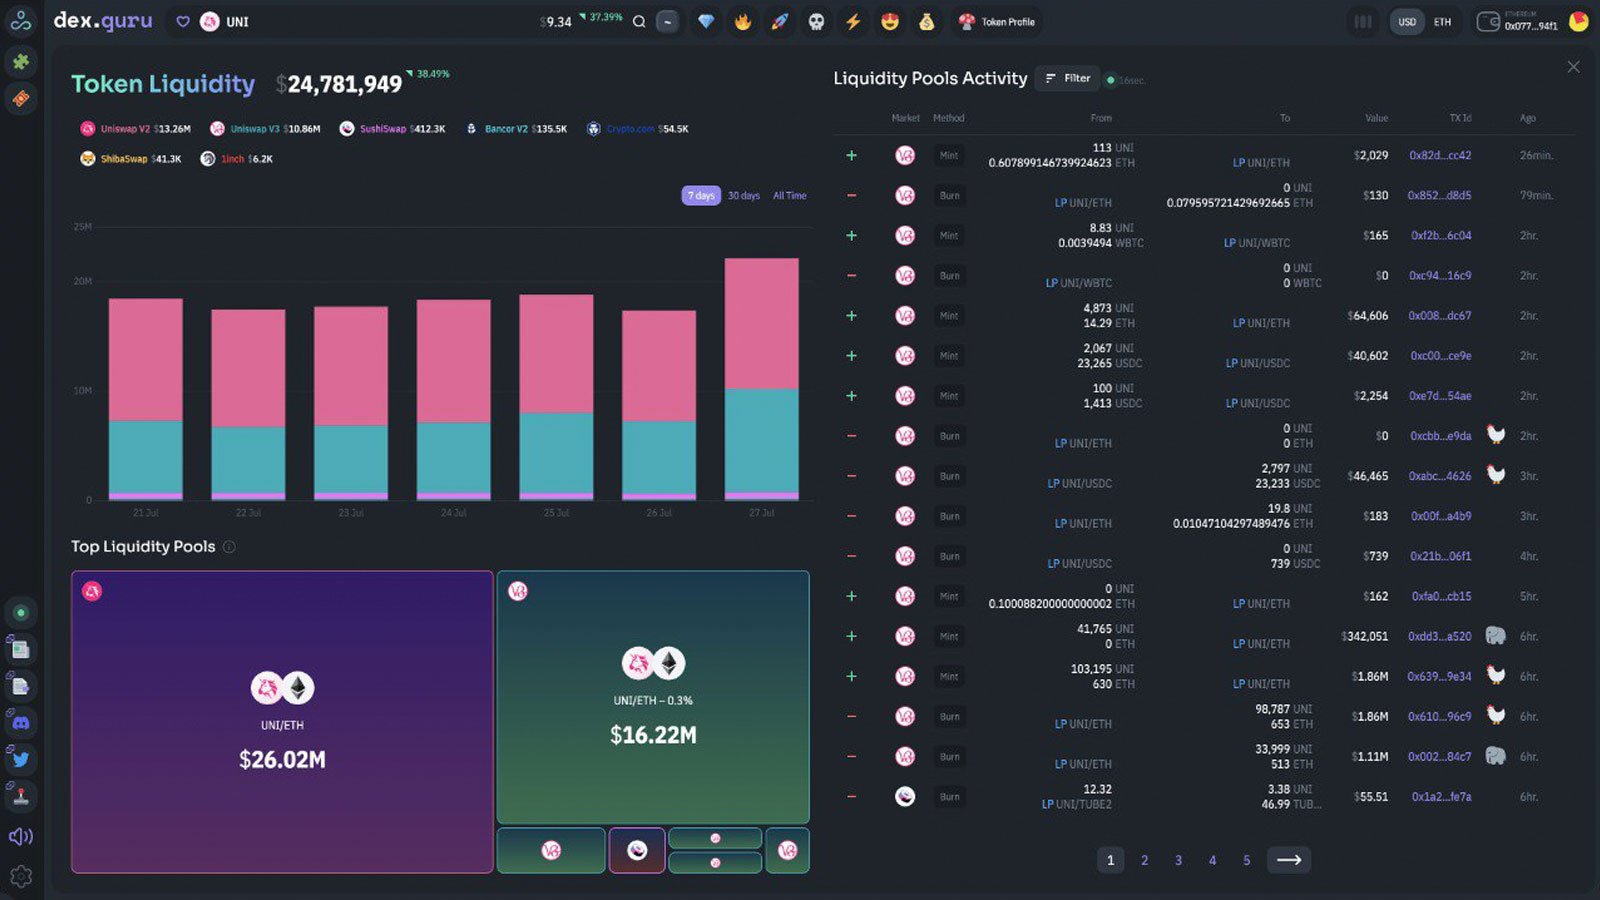
Liquidity is critical when making a trade in any market. If you paid $500k for a home that no one else would ever buy, you are holding an illiquid asset and won’t be able to turn a profit. In the land of DeFi, low liquidity pools lead to trades and faster price movements. Imagine trying to sell $1000 of an asset into a pool with $3000 in liquidity - it would be impossible to claim the value, and the price could fall drastically in selling the asset!

Using the DexGuru token liquidity page, traders can watch the liquidity pools of their favorite assets. In this tab, users can view the total liquidity and how it is dispersed among different pools and protocols. This data is updated every 30 seconds, so you never miss a market movement!
Volume
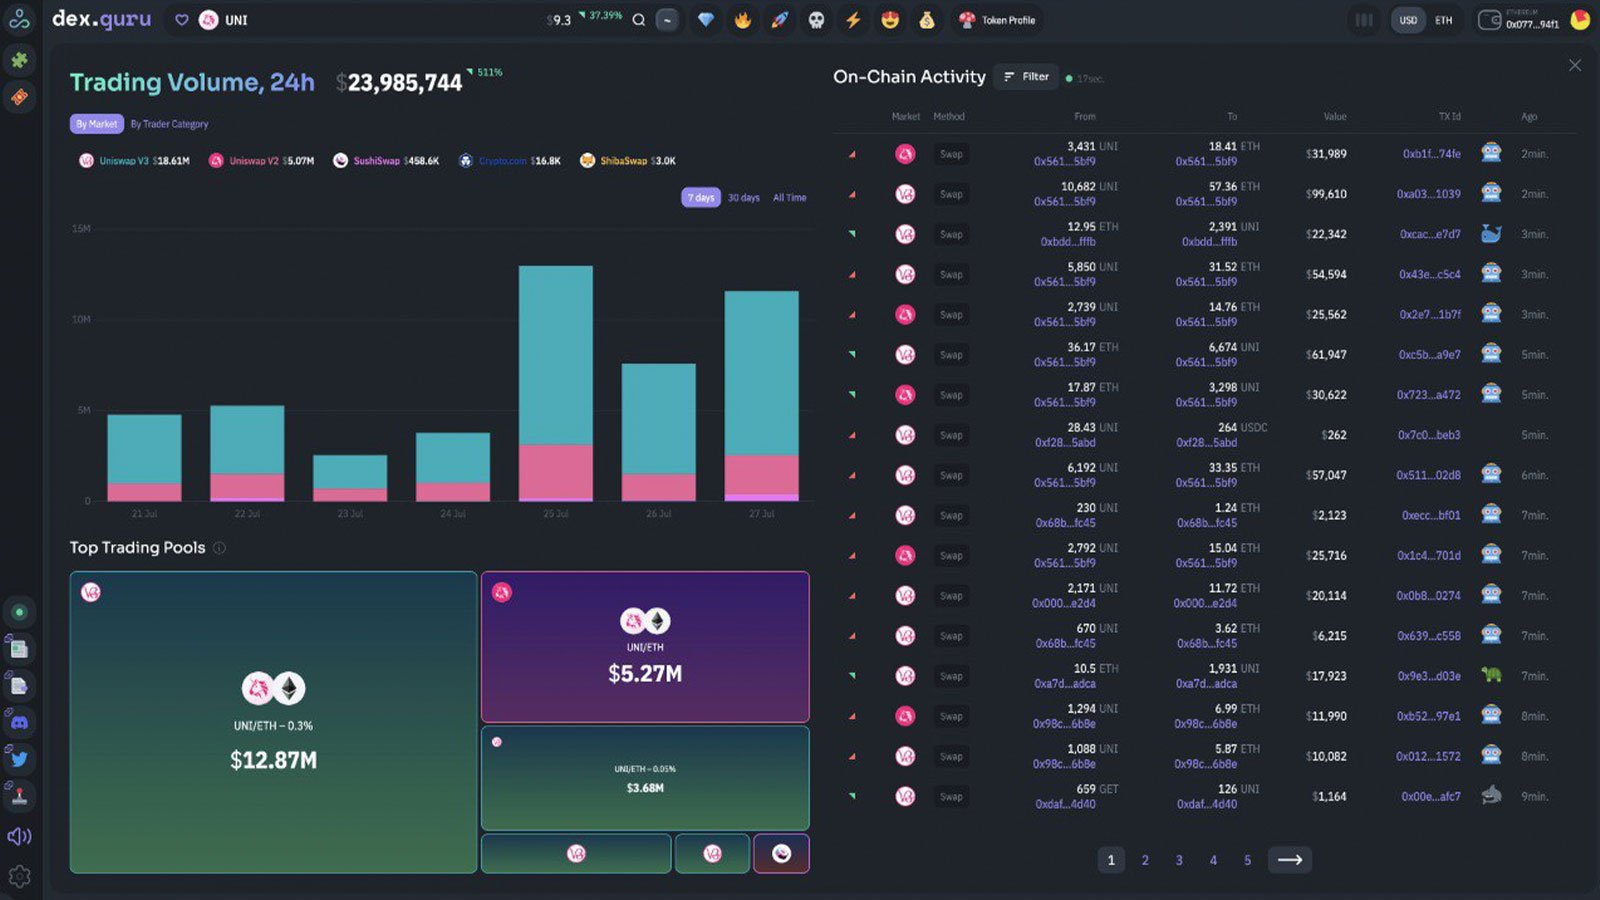
Trade volume showcases the attention a specific asset receives in the market. Volume can be positive or negative depending on the nature of the swaps, which is why it is essential to have in-depth data.

Using the DexGuru token volume tab, traders can view the current volume for a particular asset and its daily volume going as far as months back. Watching which pools are doing the most volume can also give great insight into where you should be making your swaps. Finally, if you are looking for specific transaction types, whether a particular trade size, trader category or liquidity pool, DexGuru has you covered. Filter through countless transactions in an instant to have all the concise data you need.
Whale Watching
Given the large amount of capital whales control, retail traders and investors often see these investors as experienced and knowledgable. Thankfully, in the crypto world, whale movements can be viewed real-time instead of quarterly in TradFi. DexGuru’s token profile offers traders a way to view the top holders, their average entry price and whether they’ve been loading or dumping their bags over the past seven days. Don’t be left behind; pay attention to the whales with DexGuru.
More on DexGuru
DexGuru is a trading terminal made for traders in the DeFi era, leveraging on-chain analytics combined with token swap execution capabilities. They are committed to bringing retail traders all the best tools available, with more tools added every month to give them the edge they need. With a recently launched DAO in the bootstrap phase, they are decentralizing data and the project itself.
 Arman Shirinyan
 Dan Burgin
 Alex Dovbnya