Between the CNBC headlines and the red graphs, as well as the fake picture of BTC miners being dumped, it has been a scary time for cryptocurrency enthusiasts. The fall in the BTC price from the $6,000-ish mark in November to now has caused may to worry about the health and prospects of the bigger cryptocurrencies.
However, the price is just one metric that determines just how well the market and certain coins are doing. Moreso, the price of the cryptocurrency is also the most speculative market metric on which to measure it upon.
There are many different things to consider before basing your sole assumption on the price of a cryptocurrency, and Chris Burniske, a partner at Placeholder and well known cryptocurrency voice, explains that the fundamentals of cryptocurrencies are still showing good signs.
Supply-siders and demand-siders
Burniske, in a post on Medium, explains how he views the health of a cryptocurrency by looking at its fundamentals, and this includes deciphering what is happening with the supply-siders and demand-siders.
“Supply-siders are the folks who provision the network’s service (currently, the most common form of supply-sider is a miner), and demand-siders are the ones who consume the service,” he said.”
“In terms of demand-side and supply-side fundamentals, here are the simple ones I’ll showcase:
Bitcoin Demand-Side: Number of Daily Transactions (#), Estimated Daily Transaction Value (USD), Daily Unique Addresses Used (#). Ethereum Demand-Side: Number of Daily Transactions (#), Total Daily Gas Used. Bitcoin & Ethereum Supply-Side: Hash Rate.’”
He also goes on to determine the network value, rather than using its price per coin, and this is equated thusly: “Network Value” = “Price per Unit” x “Units of the Cryptoasset Outstanding,” according to Burniske.
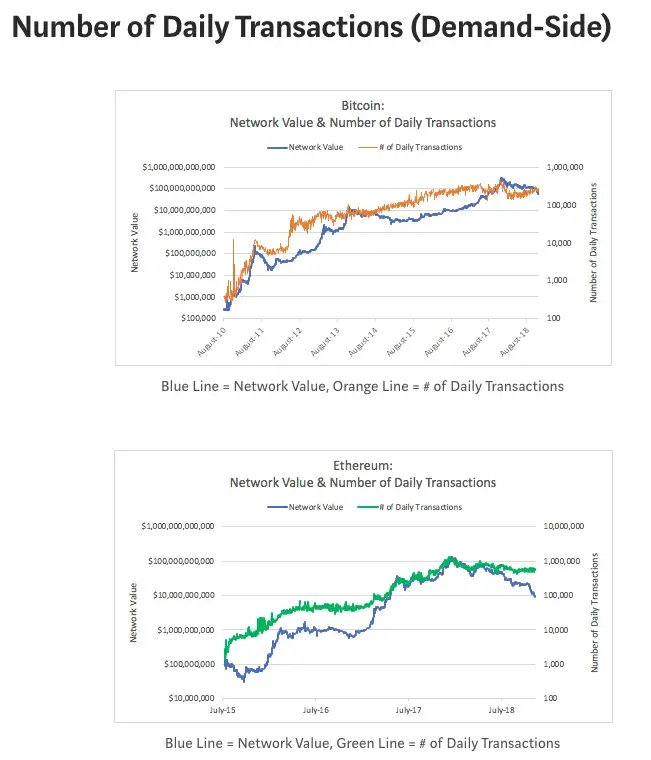
Burniske uses the above graphs to show that the while the network value of both ETH and BTC is slowly sliding, the the number of daily transactions is stable to ticking up.
From the peak, Bitcoin and Ethereum’s network values are down 81% and 93%, respectively, whereas daily number of transactions are only down 41% and 52%, respectively.
What he derives from this data is that the drawdown in the network value is actually far less than the drop in the price of both these coins.
On the supply side
Burniske goes on to look at data on the supply side, viewing the hash rates of both blockchains.
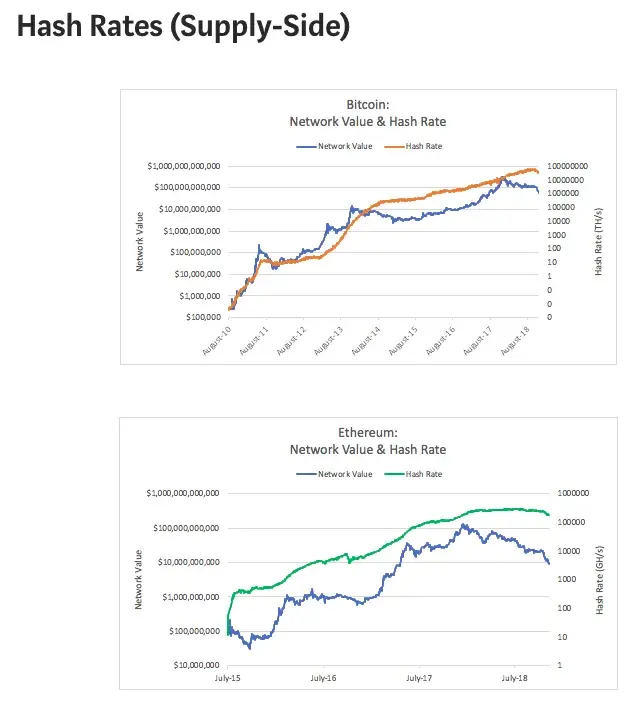
“Both Bitcoin and Ethereum’s hash rates are higher now than they were at both of their peaks. Yes, hash rate is (usually) a lagging indicator that follows price, and both Bitcoin’s and Ethereum’s hash rates are on negative slopes which require us to keep a close eye on them. But right now, this fundamental is outperforming price,” he explains
What Burniske is trying to show with this data and its analysis is that, while there is a down turn in the markets, the effects of such are not as strong as the percentage drop in price. The way in which the blockchains are functioning in terms of their supply-siders and demand-siders seems to indicate that the health of the blockchains are still much better than their price.
The speculative nature of cryptocurrencies has always seen it swing wildly, Bit price booms are followed by massive price drops. And although both these assets have lots over 80 percent of their value since their all time highs, that percentage loss is not accurately reflected if you consider their fundamental performance metrics.
 Dan Burgin
 U.Today Editorial Team