Despite growing moderately during the last weeks, Stellar doesn’t seem to give up its 9th spot in the chart to Tron. Traders suspect that XLM is preparing a surprise for us. How much will it cost in the nearest future? Read Stellar (XLM) price predictions from TradingView experts to find out.
Triangle is successfully broken
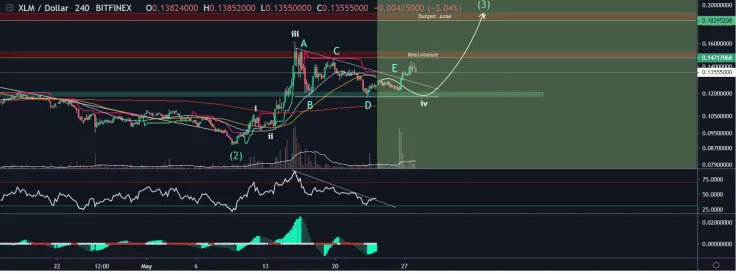
Stellar is in a sideways trend at the moment. This is typical for the 4th wave of consolidating in the triangle, but according to tommyelltom, we are most probably still in the 3rd wave of the bigger degree.
As we have broken the triangle, our projection is now up to the target shown on the chart. On the way up there is a higher peak which is our resistance. If we want to reach the target of $0.18, this resistance has to be broken, and it seems like Stellar has enough power for it.
We’re out of the downtrend
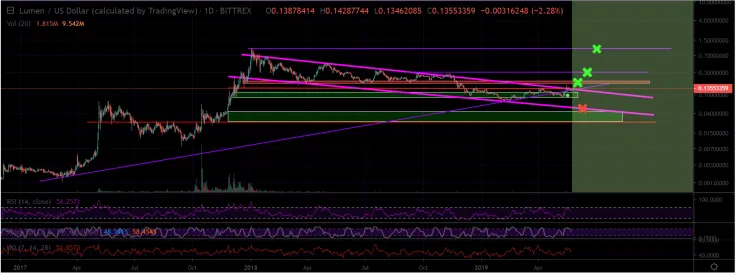
At first, it seems bearish that Stellar hasn't had a sustained breakout from its downtrend channel, but XLM has also bounced significantly more than some other alts since its recent bottom against Bitcoin, during which it reached an older long term support level. The bearish channel bottom is in the $0.05 cents zone. However, while everyone is watching the new hyped coins, this may be an opportunity to take advantage of people who have fallen asleep on some of the established alts.
Looking at the graph zoomed in, we can see that this is the first time XLM has been pinched by these two long term resistance lines. It's time to make a decision. The first step would be for XLM to close this current daily candle green. After that, we could have a stab at the $0.18 resistance zone:
A potential trade setup would be to BUY the breakout above $0.135 to target $0.18, $0.25, $0.30, and then $0.90-$1.00. One could also buy if today's candle closes green above the support line. Since these two major trendlines are converging right now, we should see if it causes a reaction.
How high can XLM go? $0.5 is the next target
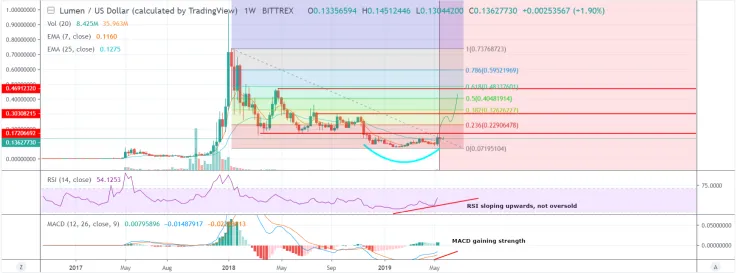
The recent week hasn’t been as successful as the week before that, but the potential is overwhelming. Here’s why.
If we look at MACD, we see we are gaining momentum which would indicate this move is just beginning. What makes this move different from the candle in October or July? MACD at this time was sloping down or flat. This time, it's on a steady rise indicating buying pressure.
RSI is sloping up, still has a ways from being in oversold territory.
With the confirmation of these 2 indicators, we can now look for an exit point to the positions we took in XLM from 10-12.5 cents. First, we have already broken the minor overhead resistance points and are starting to break the next major one at the $0.18 area. Once this is broken, we will see a move up to the $0.30 area. This area will prove interesting, but although we want to see a move to $0.99, now our first target will be just below this $0.50 area. We have a major top there, it's a psychological point which should prove a resistance point, there are some overlapping fib points there.
Interestingly, XLM/BTC is sitting on this 78.6 retracement, RSI is rebounding off oversold territory and MACD is starting to turn. It's definitely primed for a move.
Bottom line
Before the triangle was broken, we tried to guess whether it would be to the upside or downside. XLM has continuously been one of the worst performing coins during the second half of the bear market. During the first half, it did relatively well. After reaching a bottom at 7 cents, it bounced all the way up towards 16 cents, only to be sold back below support. Since then, it has actually managed to get back above the support line. This is the second time it has done that recently. The first time it got back above support, it went straight to $0.16. That proves it has accumulated enough strength.
Stellar (XLM) price charts are taken from TradingView
 Arman Shirinyan
 Dan Burgin
 Alex Dovbnya