
Positive developments keep being announced by Ripple, yet somehow, they are not reflected in XRP’s charts. The latest announcement is that in a matter of weeks, Euro Exim Bank is set to begin using XRP-based xRapid for cross-border payments. The technology will be fully integrated and the bank plans to use XRP for payments across 80 countries.
Many of Ripple’s other partners are using the technology in some way, but so far none have opted to send international payments by exchanging their local currency in XRP. All in all, this is great news for XRP, but the impact will be best seen once Euro Exim Bank actually starts using it.
Chart Analysis – XRP/USD
Ripple’s XRP currently stands at 2nd place by market cap, behind Bitcoin and ahead of Ethereum, but has lost almost 12% over the last 7 days, trading at 0.326 (Bitfinex) against the US dollar.
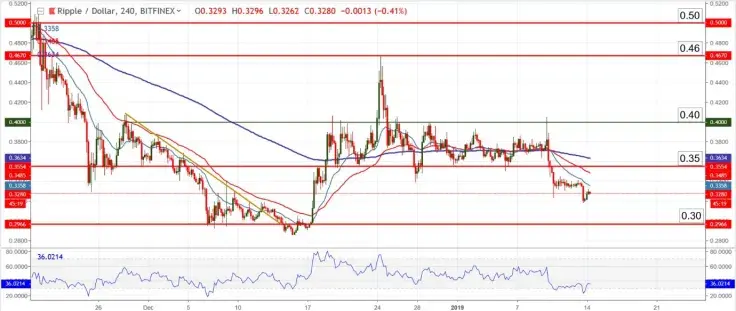
The pair broke the horizontal channel created between 0.40 and 0.35, and usually when the price exits such a pattern, it continues in the direction of the initial break. This makes us anticipate an extended period of downside price action, possibly headed towards the key support at 0.30. Even if that target is not reached, the bias remains negative as long as XRP is trading below 0.35.
Support zone: 0.30
Resistance zone: 0.35 and the EMAs to some extent
Most likely scenario: continued drop, minor upswings
Alternate scenario: RSI is moving up from oversold, so we may see stronger moves up
 Dan Burgin
 U.Today Editorial Team