It’s easy to forget now but Bitcoin’s historic bull run to its current all-time high of $20,000 wasn't particularly smooth.
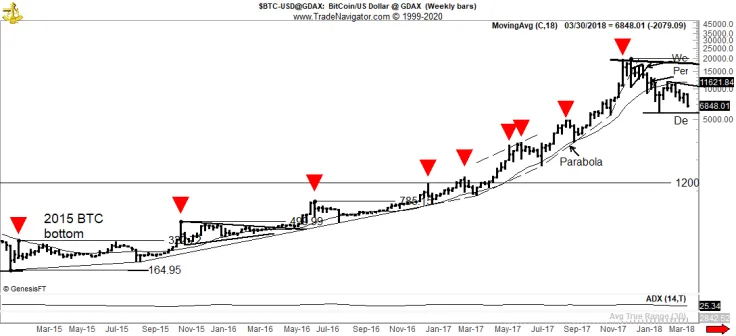
Commodity trading veteran Peter Brandt has estimated that the world’s largest cryptocurrency had to endure nine painful corrections over the span of two years (from 2015 to 2017).

Bitcoin’s thorny path to $20,000
Brandt claims that the average decline from high to low was 37 percent. It would take Bitcoin approximately 14 weeks to recover from each significant drawdown.
Bitcoin shed over 40 percent value in a little over a month from June 2017 till July 2017. The top coin also witnessed a drop of similar scope in September that year (from Sept. 3 to Sept. 17), with the correction exacerbating after China announced its infamous crypto ban.
Even when the 2017 crypto craze was kicking into high gear, Bitcoin saw a 20 percent plunge in early November.

A world of difference
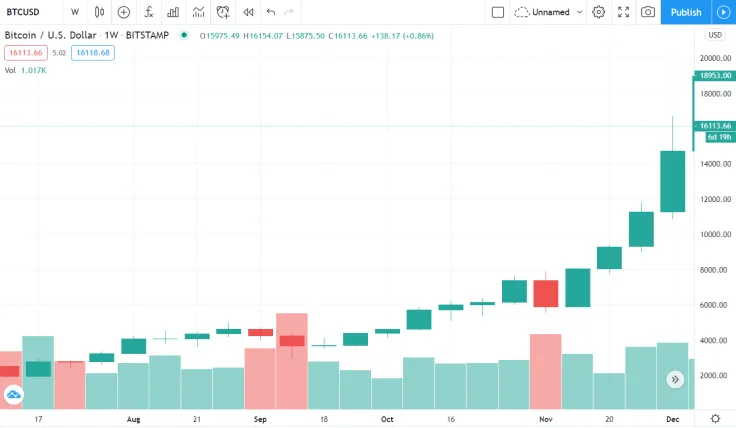
The ongoing rally has so far been exceptionally smooth for Bitcoin, with a whopping seven green candles in the row on its weekly chart.
On Nov. 16, the cryptocurrency recorded its highest three-week close to date, and this November is on track to become Bitcoin’s best month ever, blowing December 2017 out the water.
As Brandt points out, BTC has so only two double-digit corrections since early September.
At press time, the cryptocurrency is trading at $16,119 on the Bitstamp exchange after the bears attempted but failed to push the flagship coin below the $15,700 support.

 Vladislav Sopov
 Dan Burgin