Disclaimer: The opinions expressed by our writers are their own and do not represent the views of U.Today. The financial and market information provided on U.Today is intended for informational purposes only. U.Today is not liable for any financial losses incurred while trading cryptocurrencies. Conduct your own research by contacting financial experts before making any investment decisions. We believe that all content is accurate as of the date of publication, but certain offers mentioned may no longer be available.
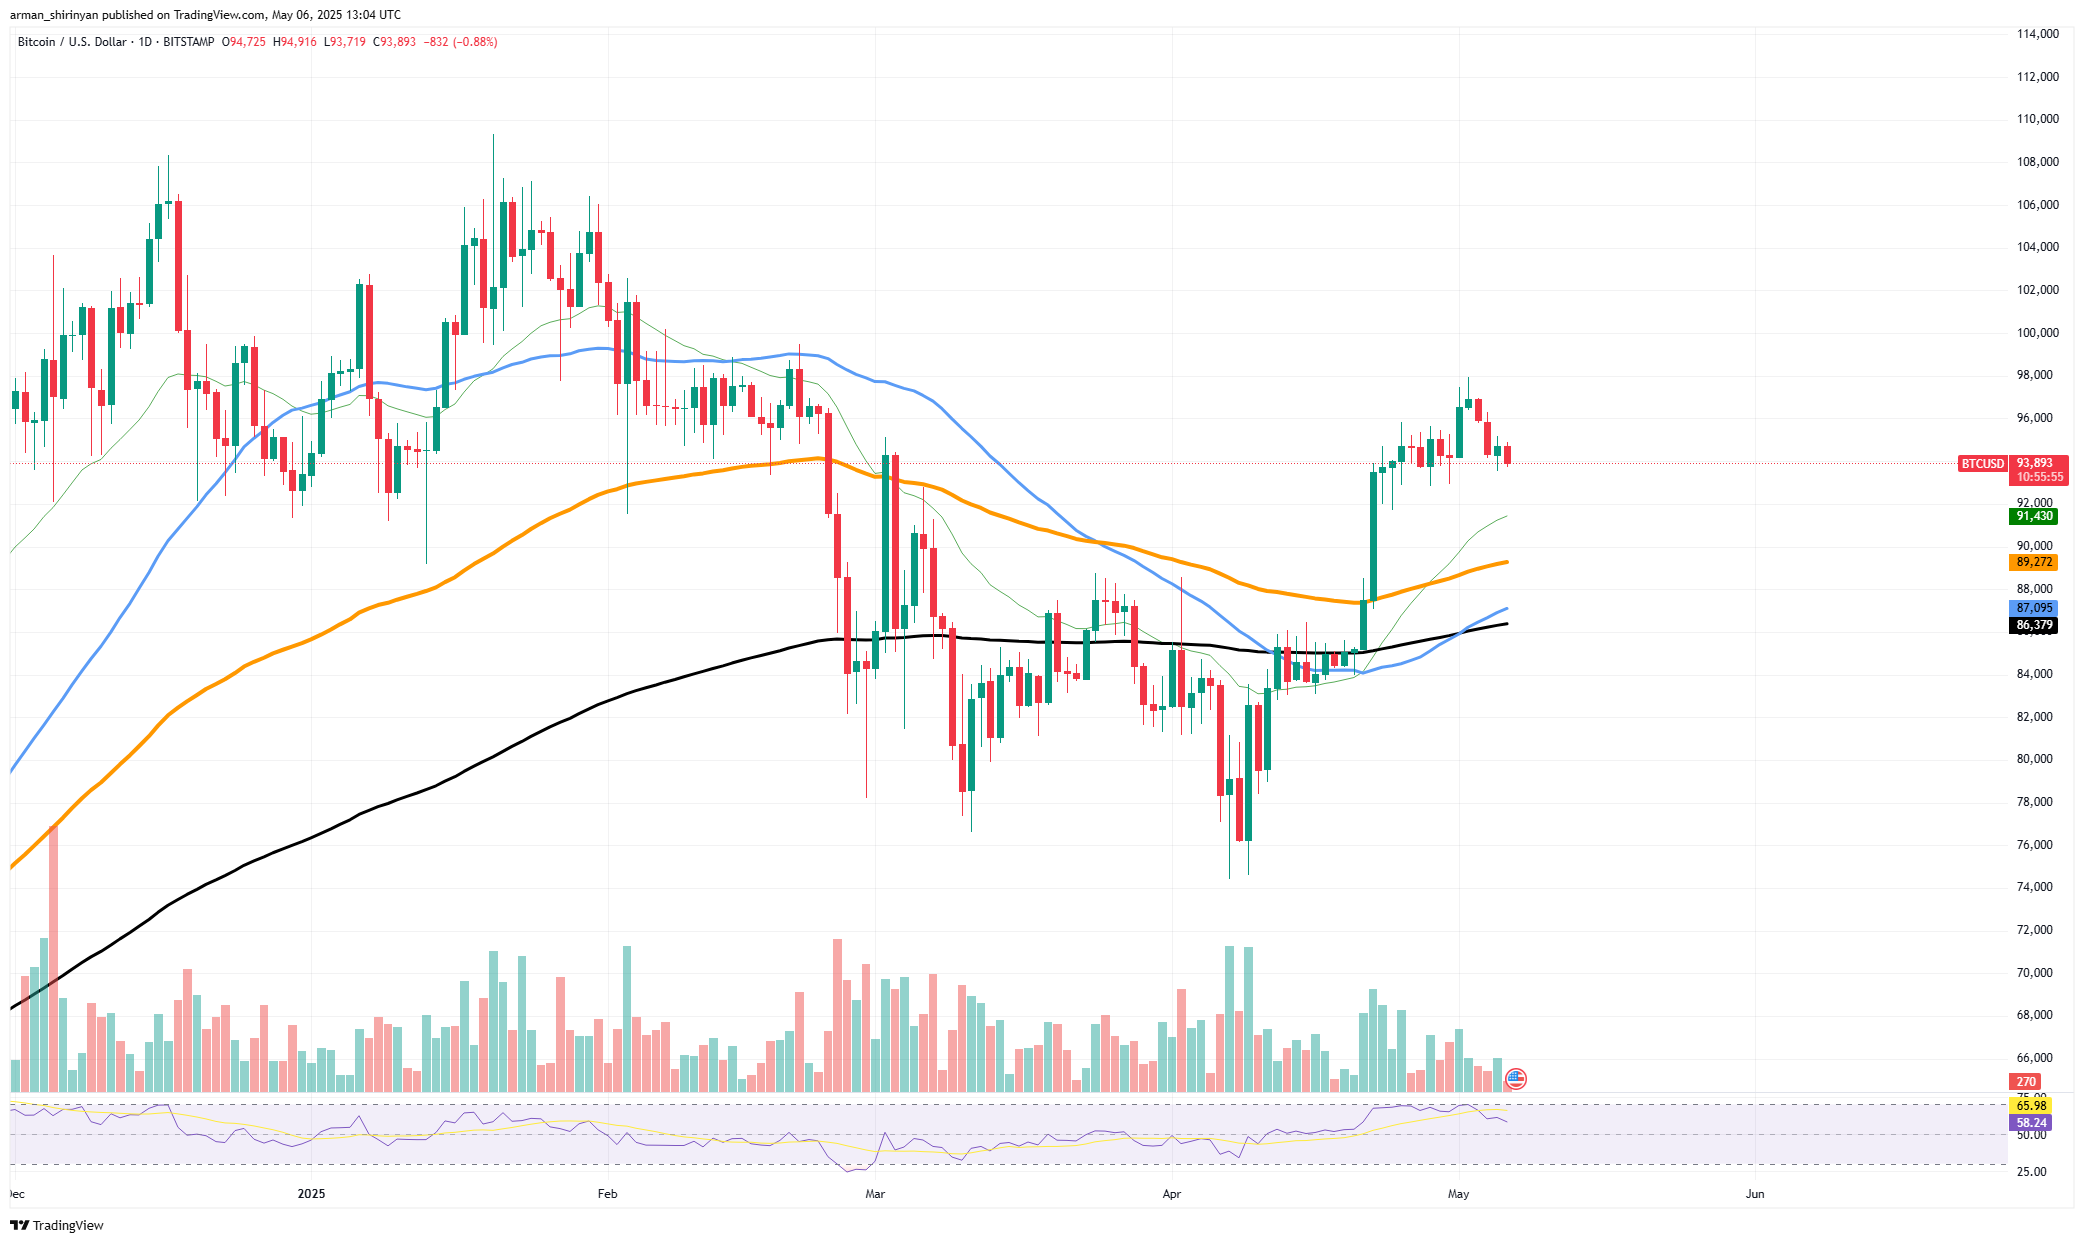
The fabled Head and Shoulders pattern is one that Bitcoin seems to be forming that could be crucial and is raising eyebrows among analysts. Bitcoin cooled off after peaking at almost $96,000, forming a structure that might be seen as the pattern's right shoulder. Early April saw the establishment of the left shoulder at about $84,000, the head peaking at about $96,000 and the neckline falling between $85,000 and $83,000.
A potential trend change is suggested by this setup, which frequently comes before bearish reversals. The narrative is complicated by Bitcoin's current macro and technical background, though, as patterns are only as strong as the context in which they form. The golden cross, a bullish technical signal in which the 50-day moving average crosses above the 200-day moving average, was displayed by Bitcoin earlier this month.

Its recent formation in May contributed to the push of Bitcoin to its cycle high and, historically, it has marked the start of notable upward directions. However, since then, price action has stalled. Bulls are losing steam when the RSI cools off from overbought conditions and there is no follow-through volume.
Although the momentum is obviously slowing, there is not yet a collapse. A more severe correction may occur if Bitcoin falls below the neckline ($87,000-$88,000), potentially revisiting the 200-day EMA close to $86,000. However, it is too soon to place a wager against Bitcoin.
The pattern may be completely invalidated by a significant bounce from the neckline, particularly if macro drivers or ETF flows take over. Although the general trend is still bullish for the time being, the next significant directional move will probably be determined by this range, which is between $93,000 and $88,000. Either a bearish reversal is confirmed or a new leg higher is beginning, and Bitcoin is at a crossroads. There should be clarity in the days ahead.
XRP moving down
The 200-day Exponential Moving Average, which is frequently regarded as the reset point for assets crossing from a bearish to a bullish phase, is where XRP has formally returned. XRP dropped below important short-term moving averages such as the 50 and 100 EMAs after its recent rally stalled around the $2.30 mark.
It is currently holding onto support at the 200 EMA, which is close to $1.98. This level is a crucial cutoff point. If it is held, XRP is still capable of exhibiting a long-term trend. The outlook is far from optimistic, though. Growing bearish volume and a falling Relative Strength Index (RSI), which is currently hovering around 42 and is edging closer to oversold conditions but not quite there, have accompanied the decline.
If XRP breaks through this support and closes below the 200 EMA, there may be serious repercussions. The psychological $2 mark may give way to a deeper decline; the next support is probably going to form around $1.90 or even lower, at the $1.75 zone, which was last tested in early April. On the other hand, bulls would need to regain the $2.15-$2.17 area in order to reverse the decline and show signs of life.
Additionally that level coincides with the EMA confluence that XRP has now dropped below, indicating that it is a confirmation zone and a resistance cluster for any recovery. In other words, technically XRP is starting over. It is currently struggling to preserve its long-term structure after losing recent bullish gains.
In addition to indicating another correction, a break below the 200 EMA has the potential to turn the entire narrative back to bearish in the near future. On the basics of its trend foundation it is currently a waiting game.
Dogecoin's warning
Dogecoin is losing contact with important support levels and is displaying a number of warning signs. DOGE's decline below its 50-day Exponential Moving Average (EMA), which is presently at about $0.17, is the main cause for concern right now. The meme coin is currently in risky territory after breaking this level, which served as temporary support during the most recent consolidation phase.
At the moment, DOGE is trading close to $0.165 above a shaky horizontal support level. If this does not work, there is a stronger base around $0.145, which has historically been a bounce zone, and the next important support is close to $0.155. With $0.20 and $0.216 serving as the next resistance checkpoints, DOGE must recover $0.17 in order to reenter a bullish posture.
A grimmer picture is painted by volume. Consistently declining trading activity indicates that neither bulls nor bears are very convinced. Volatility frequently follows this type of volume, though not always in the way that holders would prefer. An imminent surge in downward momentum may be indicated by this volume silence in conjunction with the break below the 50 EMA.
At approximately 44, the Relative Strength Index (RSI) indicates neutral-to-bearish momentum. Before oversold territory is reached, more declines could occur, which could encourage short sellers or put additional pressure on weak-handed holders. Despite Dogecoin's inherent element of surprise, which is frequently fueled by social media and well-known endorsements, the current technical setup strongly favors bearish continuation unless there is a significant resurgence in buying interest.


 Vladislav Sopov
 Dan Burgin