With altcoins going down, Ethereum follows the trend and stays close to the support line. Traders are wondering: how long ETH will stay on the current level, and will downtrend go on?
Here are a few opinions of users from TradingView - their ETH price predictions will give you a better understanding of the crypto market.
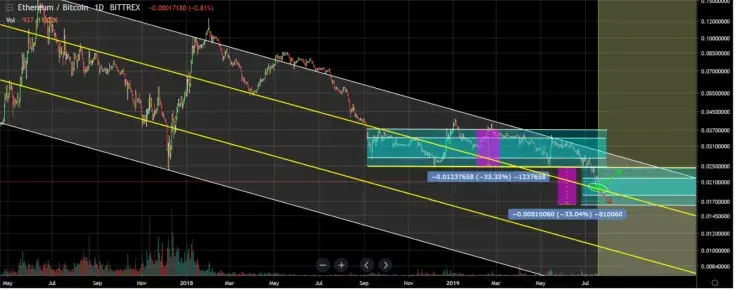
ETH broke through the accumulation channel

As we see on the chart, ETH broke through the channel of accumulation. In most cases, the price goes down to the width of the old channel.
But it is possible to stop on the trend line of the descending channel (yellow line). What do you need to do in such situation? Better observe, but not enter.
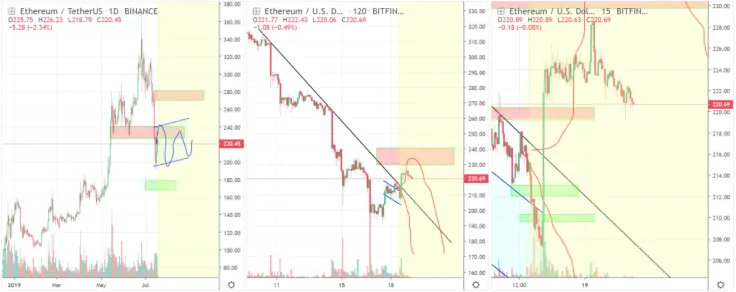
Bull trend is gone

Like all the alts, ETH also took a very big hit past week which is not normal for a bull trend. This wave down was bigger that the waves up almost.
Not in %, but still, it should have never been this big. So what is very likely now, very small chance to see ETH simply recover this huge blow and go back to high 2x levels again. In the best case, we will consolidate between $180-250 for weeks and probably even a month or two. If we see a quick move above $240 in the coming days, than this theory might be wrong.
On the right chart, we can see it moving against a trend line. The longer it bumps against it the bigger the chances become that it will break up. With Bitcoin moving in a triangle, it has been good for alts past 2 days. But can't judge if it's a false hope or not.
However, even if it breaks up, there is still a very big chance it will be a fake breakout. Because the market of alts took such a big hit, that buyers won’t just sit and wait.
In short term, ETH looks like it doesn’t want to break up. A fail under $212 would make things shaky again and a break of $210 would probably invalidate the attempt to break that trend line. On the upside, it seems to be around $220.
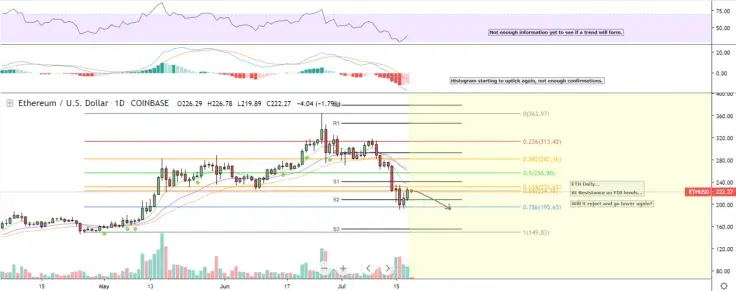
Further downturn is possible

Finding ETH in a key area. Previous play shows a retracement support found, but it has also stopped dead in the resistance zone of the FIB on the 0.618 which could be a sticking point.
Don't be shocked to see a further downturn here. It’s better to wait: ETH has already bounced high and on higher time frames, but there are not enough confirmations yet to state it will continue.
What’s in the long term?

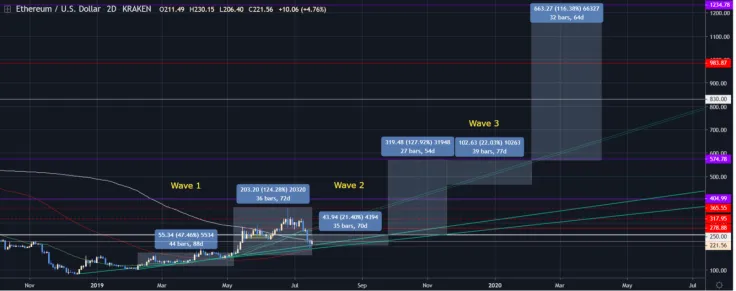
It's pretty clear now that we're at the beginning of the next bull cycle. Watch the price chart: there’s an uptrend from the bottom of the market on December 15th, and so far it’s been respected. That hammer candle just nailed it in, 8 months later.
ETH looks like it will have 3 parabolic waves up to its current ATH. So at the time of writing, ETH looks like its entering its 2nd wave of accumulation until it spikes up again early October. That means the price should be hovering around $600 by the end of 2019.
January will be a quiet accumulation month while the developers finish up ETH 2.0, staking rewards, and scalability issues. From there, February through the summer will be a movie. We'll see a $1200 Ether in April.
There will only ever be 120,120,120 ETH ever created, making it intrinsically one of the most valuable assets in the world.
Retail investors will buying up crazy amounts of ether after ETH 2.0 and staking is released end of January, there could be a supply shortage. Meaning there’s not enough Ether to go around.
Based on that alone, we should see a rise in price, but Ether has more. The 200MA is about to cross the 100MA this month, for the 1st time since the last bull run 2 years ago.
Ethereum (ETH) price charts by TradingView


 Denys Serhiichuk
 Gamza Khanzadaev