Disclaimer: The opinions expressed by our writers are their own and do not represent the views of U.Today. The financial and market information provided on U.Today is intended for informational purposes only. U.Today is not liable for any financial losses incurred while trading cryptocurrencies. Conduct your own research by contacting financial experts before making any investment decisions. We believe that all content is accurate as of the date of publication, but certain offers mentioned may no longer be available.
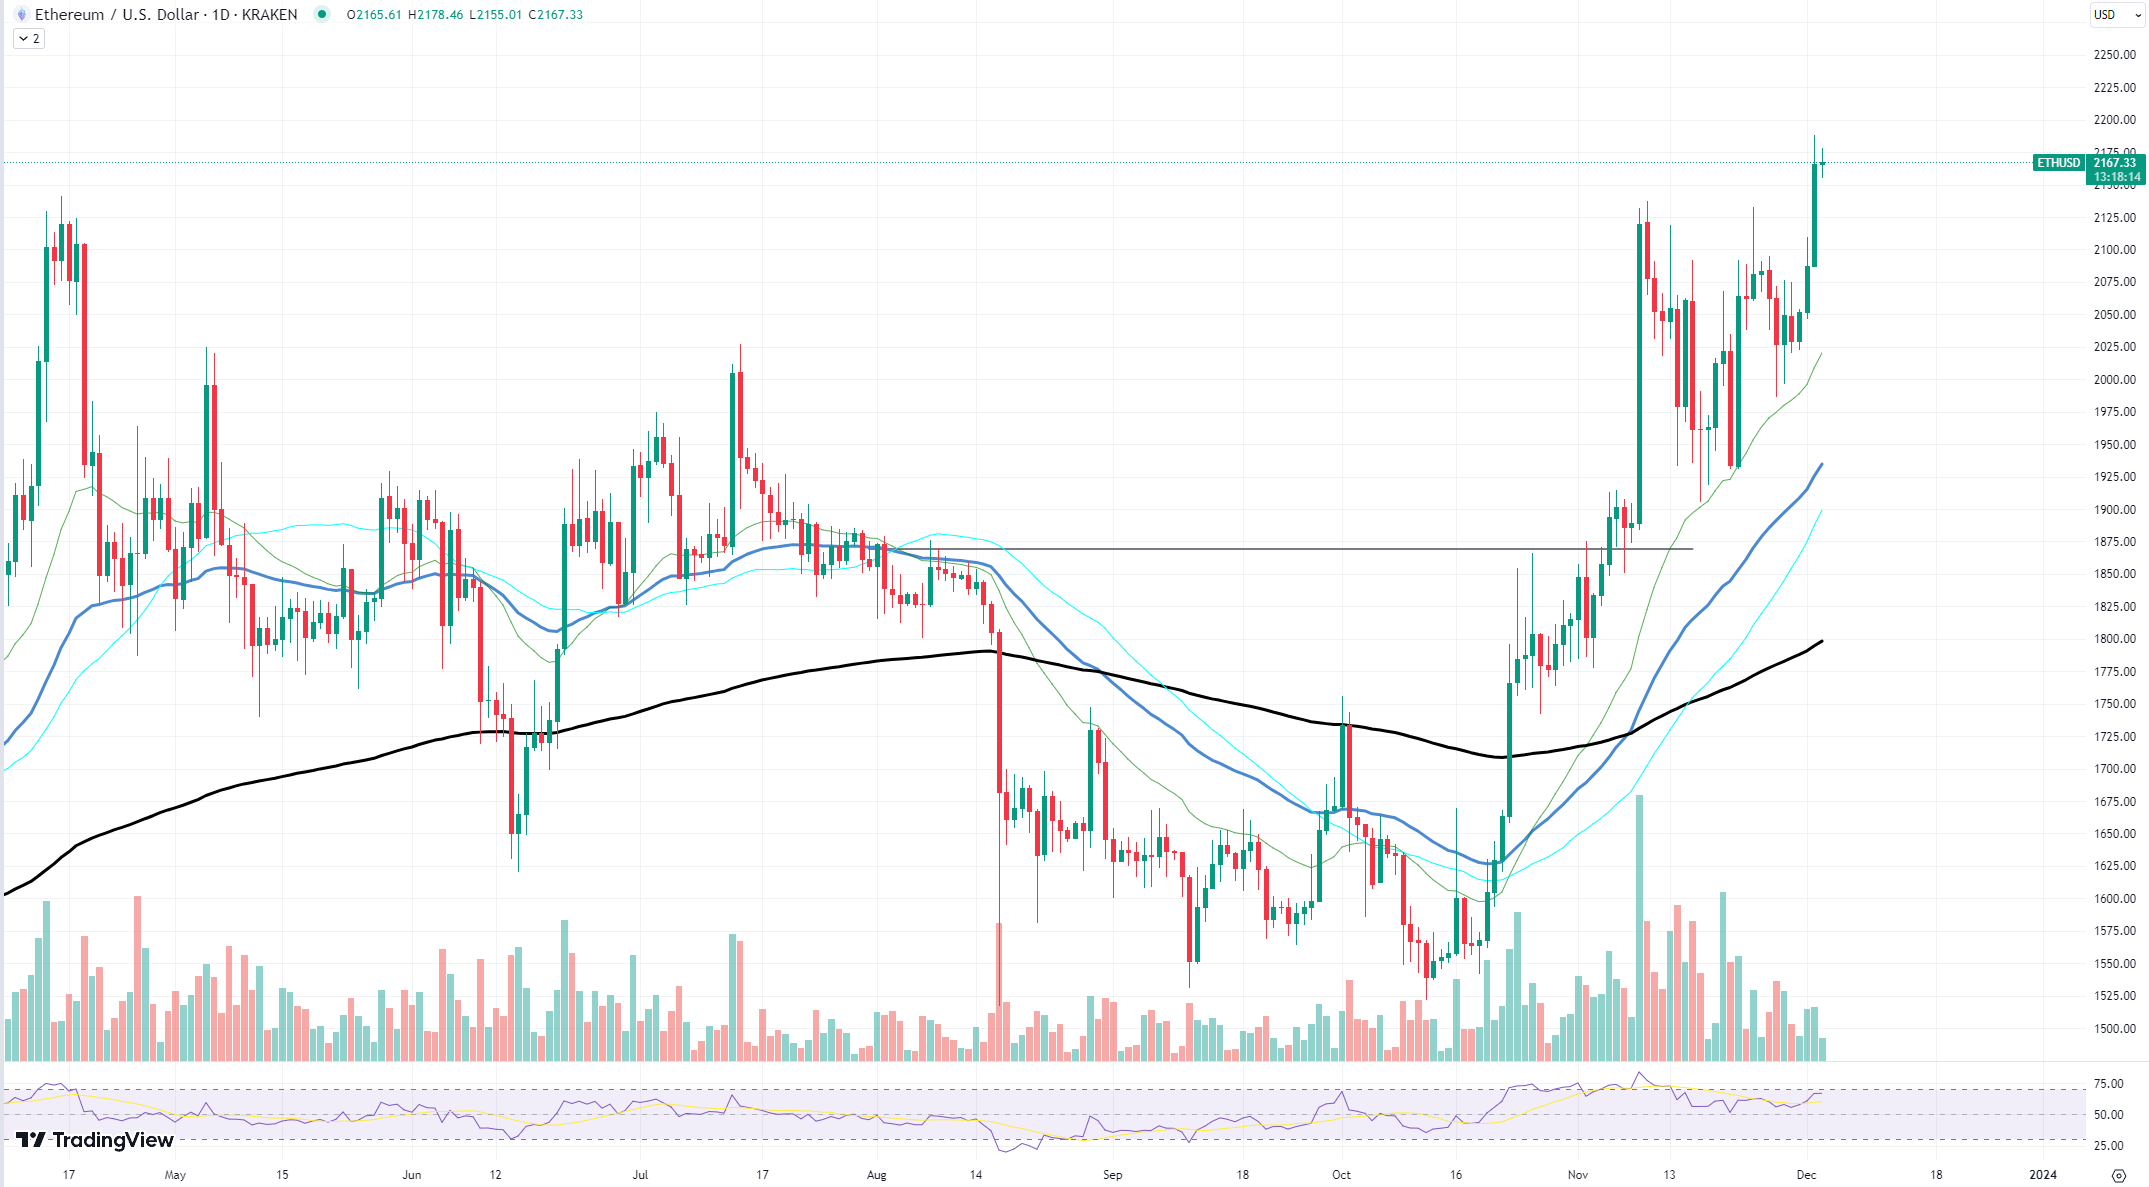
Ethereum (ETH) has recently displayed remarkable bullish behavior as the price broke through a critical resistance level. The latest charts illustrate an ascending trajectory that has left many investors and analysts contemplating the possibility of the ETH/USD chart reaching the coveted $3,000 mark in the near future.
Examining the daily chart for Ethereum, we see a series of higher lows and higher highs, which is the go-to indication of a bull market. The price has now surpassed the dynamic resistance provided by the 50-day and 100-day moving averages.

However, despite the recent uptick, the volume behind the movement is descending, suggesting a lack of strong momentum. This pattern often precedes a consolidation phase, where the price stabilizes before making a definitive move. Investors should watch for a possible consolidation, which could confirm the sustainability of the recent breakout.
Adding to the market dynamics, the rise of Layer 2 solutions (L2s) has been gradually increasing Ethereum network fees. While L2s are designed to enhance scalability and reduce costs on the Ethereum network, the transition period could lead to a slow but steady climb in fees. This rise could potentially lead to a stalemate situation in network activity if users begin to balk at higher costs, influencing the ETH price as the network's utility comes under scrutiny.
On the technical front, the relative strength index (RSI) is approaching overbought territory, yet another sign that the market could be due for a pause. A retraction or sideways movement would allow the RSI to reset, providing a healthier foundation for future growth.
The confluence of these technical indicators and the fundamental backdrop of rising network fees due to the adoption of L2s presents a complex picture for Ethereum. While the current price action looks promising for a test of $3,000, the underlying volume and network fee trends suggest that a period of consolidation or even a minor pullback might be on the horizon before any further significant upward movements are observed.
 Alex Dovbnya
 Caroline Amosun
 Godfrey Benjamin
 Tomiwabold Olajide
 Gamza Khanzadaev