Disclaimer: The opinions expressed by our writers are their own and do not represent the views of U.Today. The financial and market information provided on U.Today is intended for informational purposes only. U.Today is not liable for any financial losses incurred while trading cryptocurrencies. Conduct your own research by contacting financial experts before making any investment decisions. We believe that all content is accurate as of the date of publication, but certain offers mentioned may no longer be available.
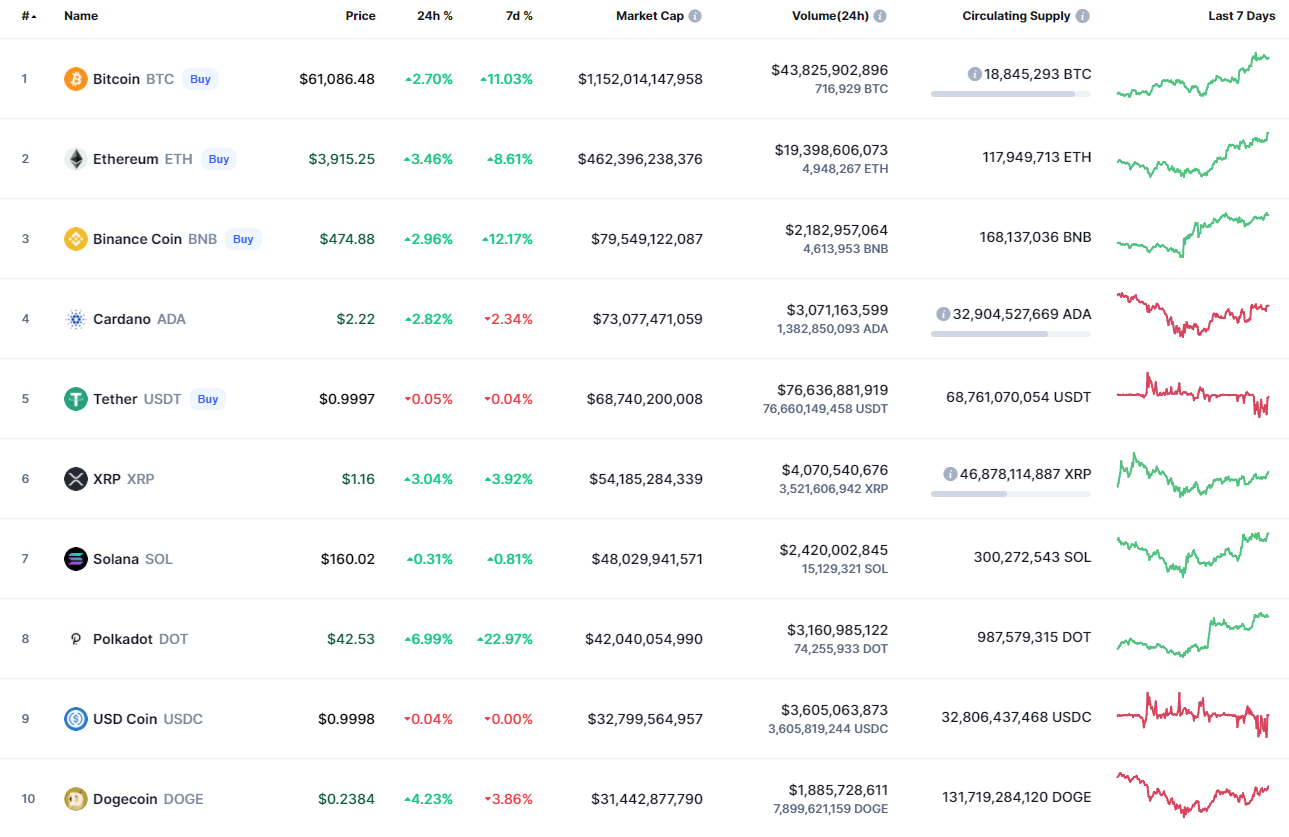
The weekend has begun with the continued growth of the market as all of the top 10 coins remain in the green zone.
BTC/USD
The rate of Bitcoin (BTC) keeps growing, coming closer to the peak around $64,000. It has risen by 2.70% over the past 24 hours.
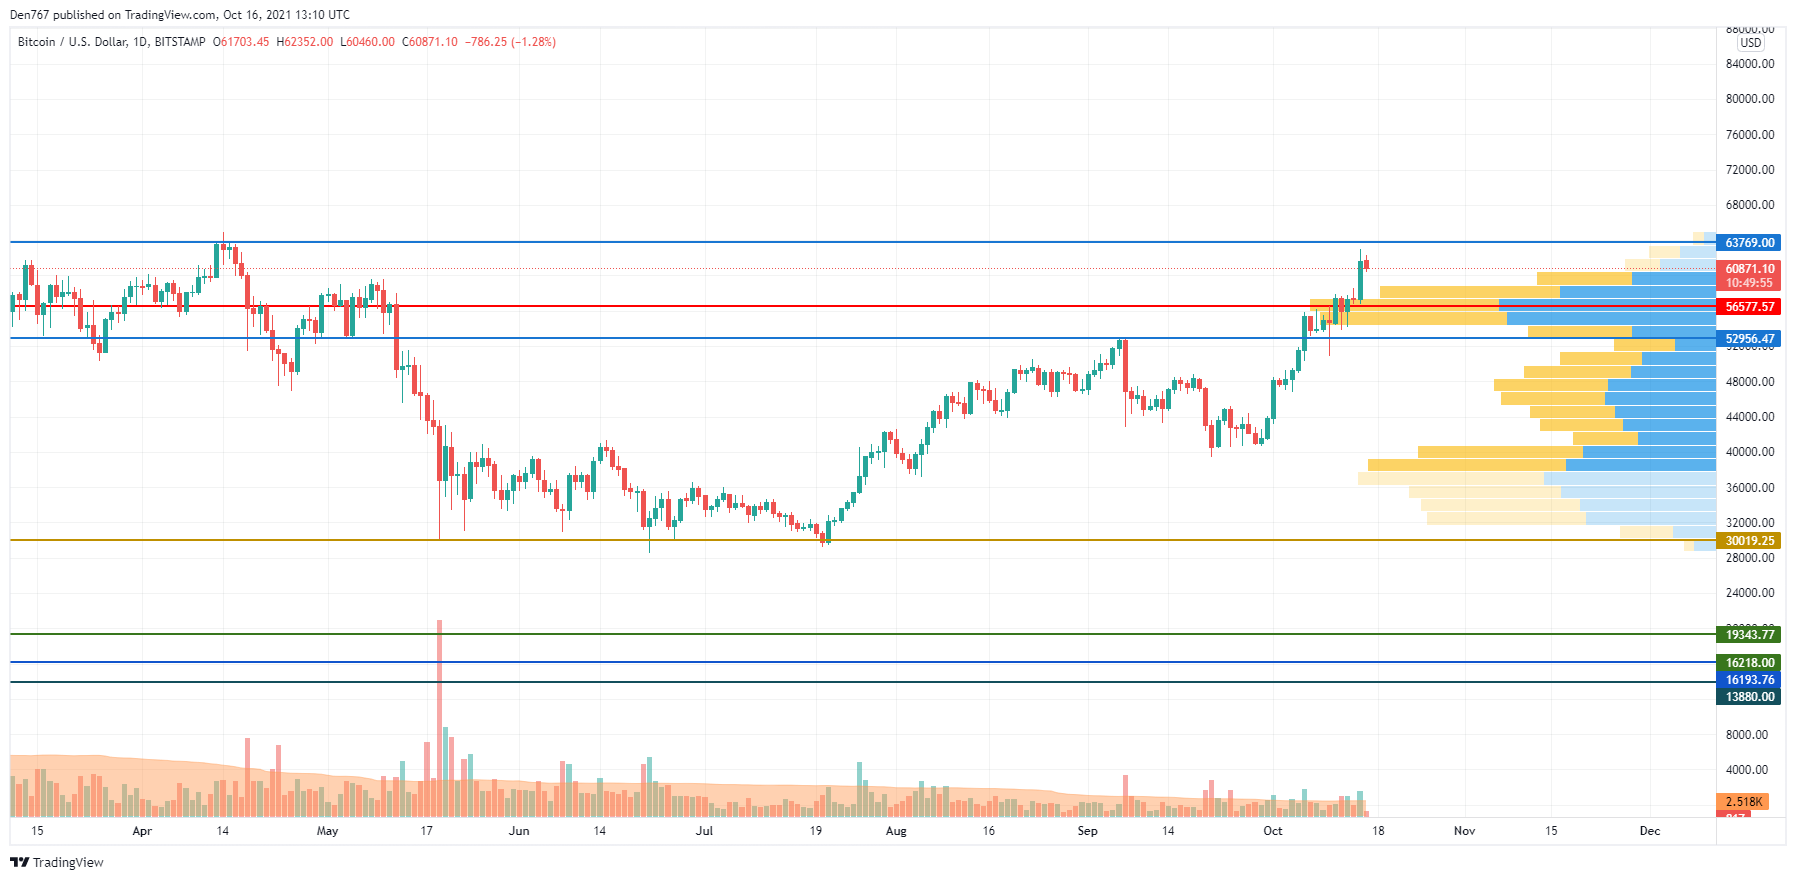
After the touch of the $64,000 mark, Bitcoin (BTC) is facing a short-term correction. Such a move might be considered a drop before the attack of the all-time high.
In this case, the more likely price action is the retest of the liquidity zone around $58,000, followed by a fast bounceback to $60,000.
Bitcoin is trading at $60,839 at press time.
ADA/USD
Cardano (ADA) is the biggest gainer today with a price rise of 2.54%.
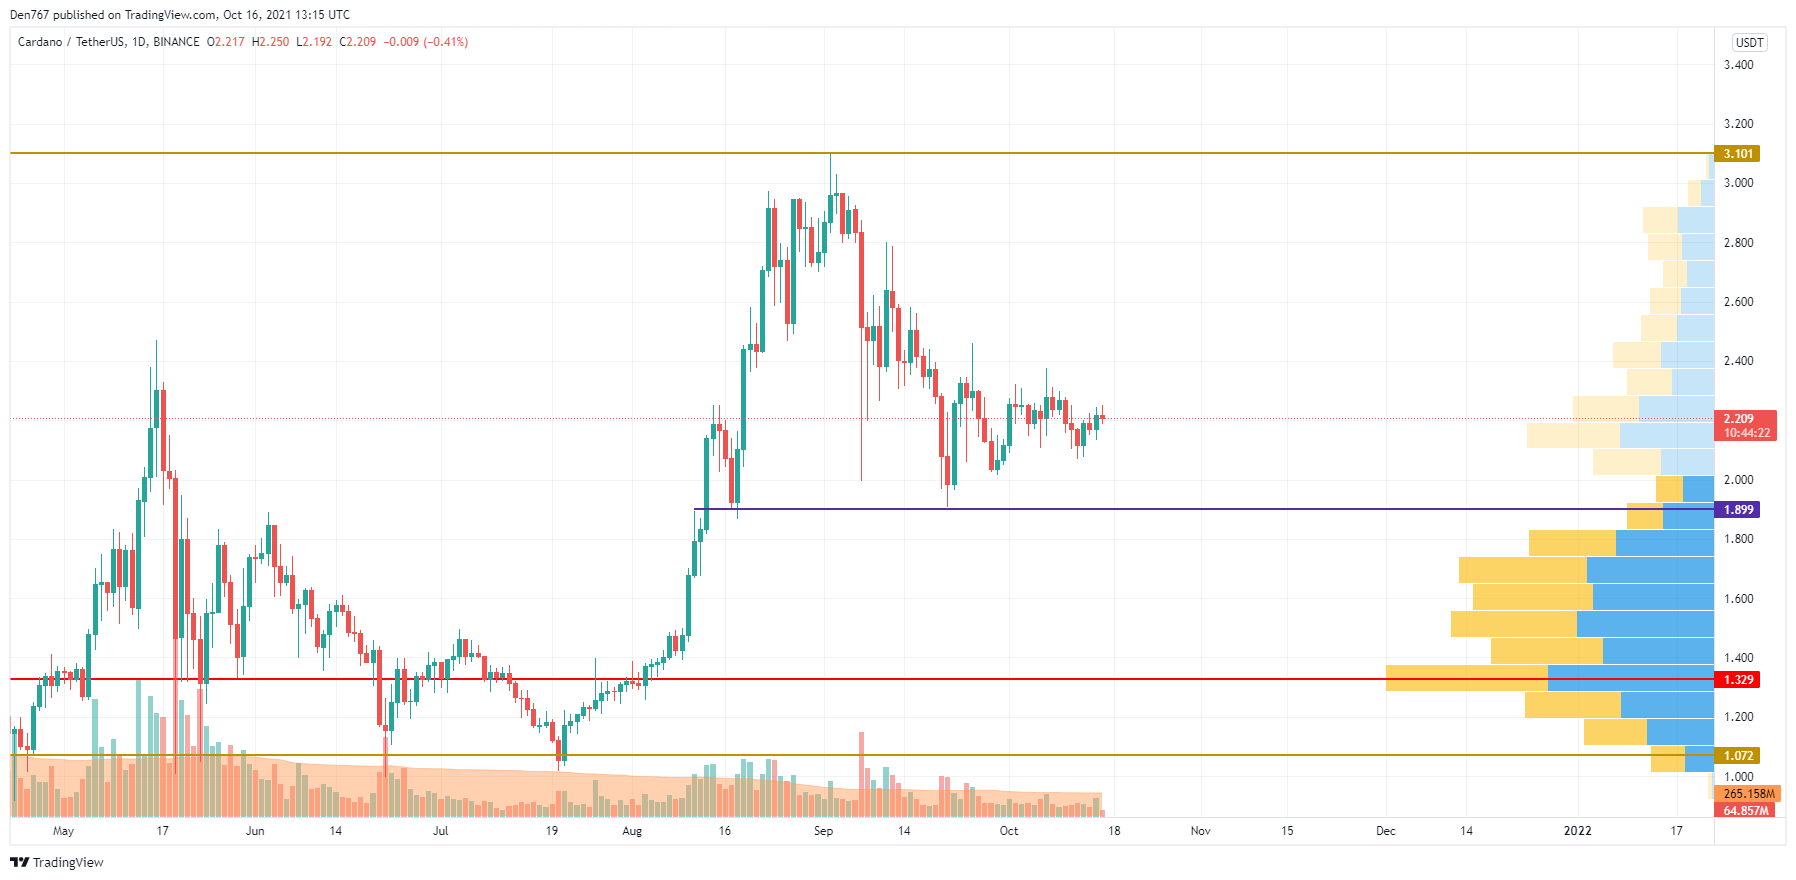
Despite the share growth, Cardano (ADA) is still located in the accumulation zone as it could not show a fast rise after a retest of the $1.90 level. The low trading activity is also confirmed by a trading volume that is not rising. Thus, consolidation in the zone of $2.20-$2.30 may occur next week.
ADA is trading at $2.20 at press time.
BNB/USD
Binance Coin (BNB) is not an exception to the rule as the rise of the native exchange coin has constituted 10.82% over the past week.
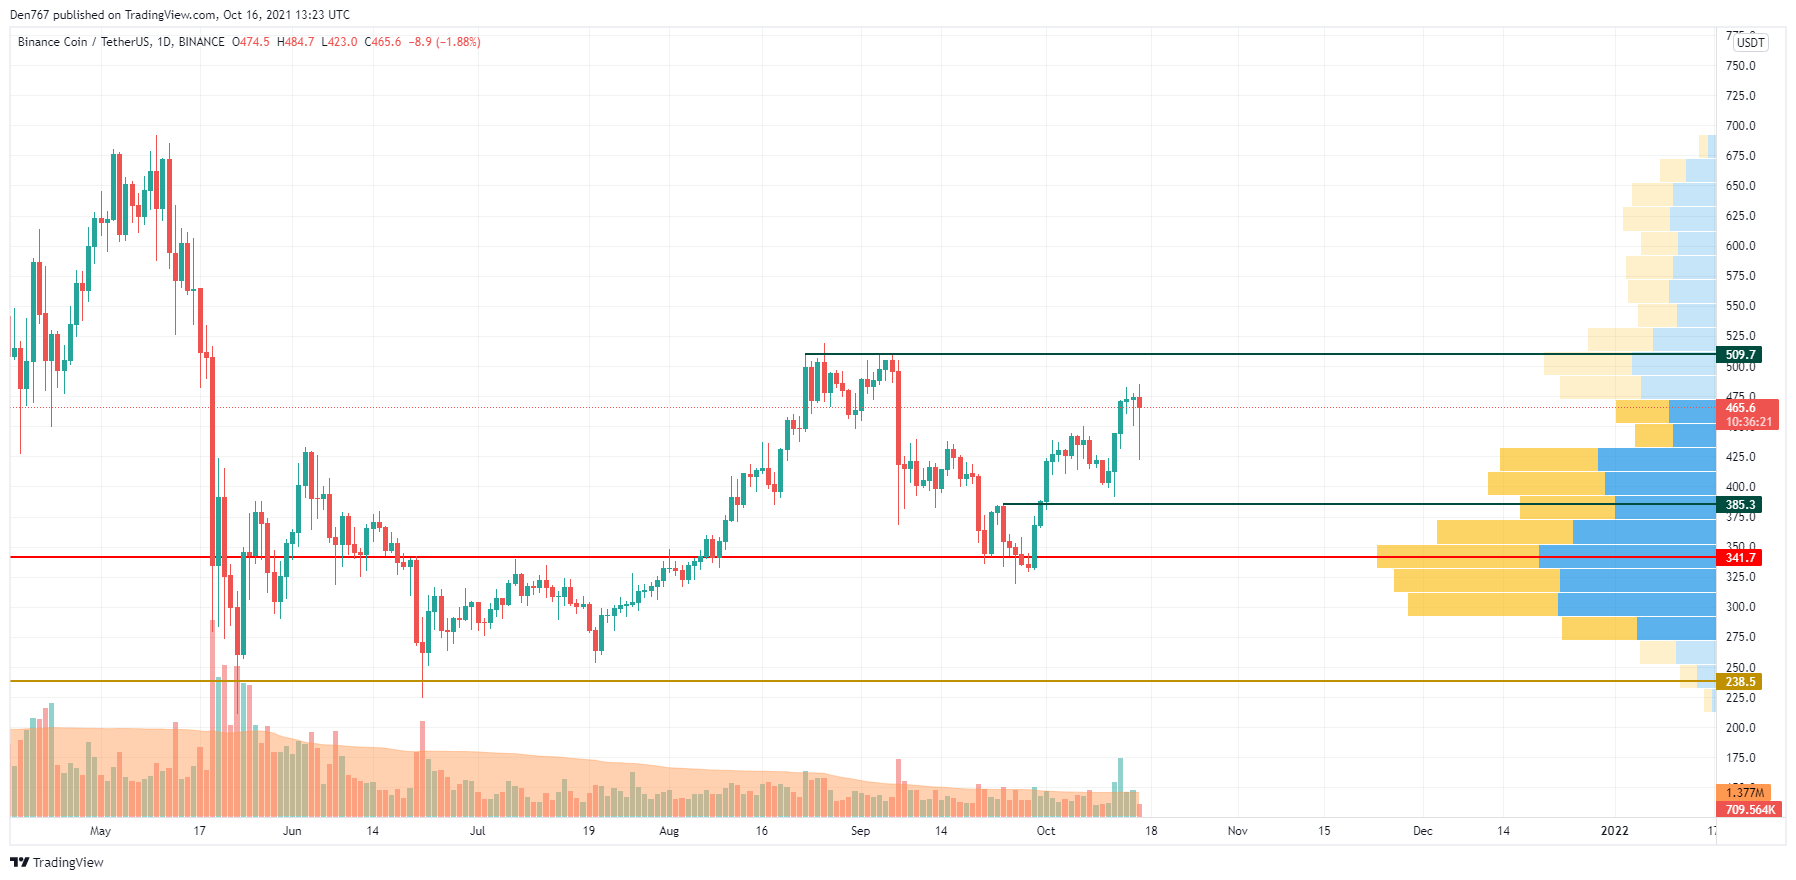
On the daily chart, Binance Coin (BNB) is coming closer to the resistance at $509.7. The trading volume is increasing, which means that bulls are getting ready for a breakout. If they manage to fix above the resistance, the rise may continue to $550 and above.
BNB is trading at $466.60 at press time.
 Dan Burgin