
*** Please note the analysis below is not investment advice. The views and opinions expressed here are solely those of the author and do not necessarily reflect the views of U.Today. Every investment and trading move involves risk, you should conduct your own research when making a decision.
Bitcoin price forecast
The Weekly chart
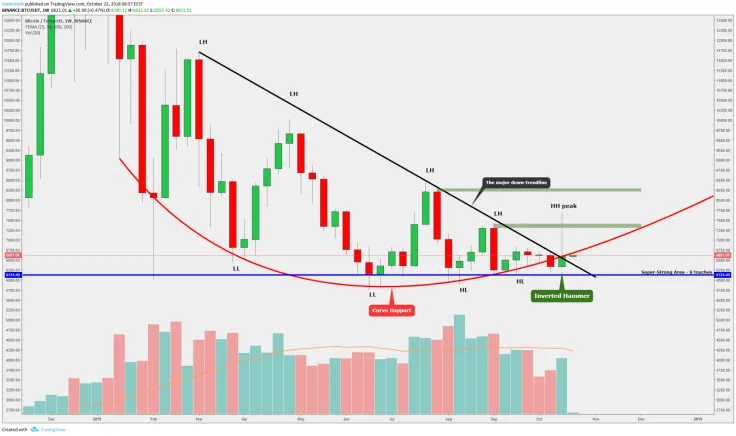
Last week Bitcoin made a big movement. From the volume perspective, it was not the highest week, but from the price range perspective, it was definitely one of the highest weeks since April (from low to high ~$1,370). Currently, the price trades above the major down-trendline which is the most important criterion. It shows that we have broken the down-trendline and are ready to go to the higher prices. The second important price action criterion is the red line — the curve support. At the moment, the price is under the curve support, but this criterion is pretty subjective to make any bigger assumption.
If we look at this chart, we can see a candlestick pattern — a bullish pattern called “Inverted Hammer.” This is a type of candlestick pattern found after a downtrend and is usually taken to be a trend-reversal signal. The pattern will indicate the price actions this week: we can possibly see a movement upwards, but let’s try to break it down on the lower time frames.
The daily chart
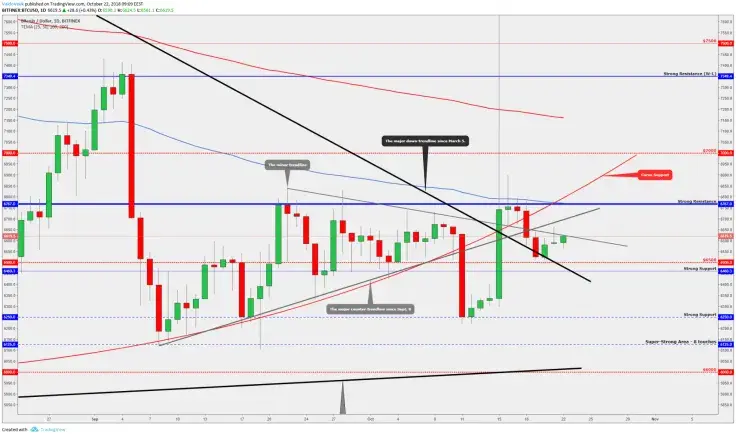
It’s clearly visible on the daily time frame that after the massive rally upwards and after the major down-trendline breakout, the price came down pretty quickly, and on Friday, it made a trendline retest. After the retest, the Bitcoin price has made a slow and steady climb upwards to the minor trendline which is now working as a resistance. It tried to make a breakout above the trendline yesterday but got rejected. Currently, it tries again, and it is a good sign since it indicates the buyers still want to see higher prices.
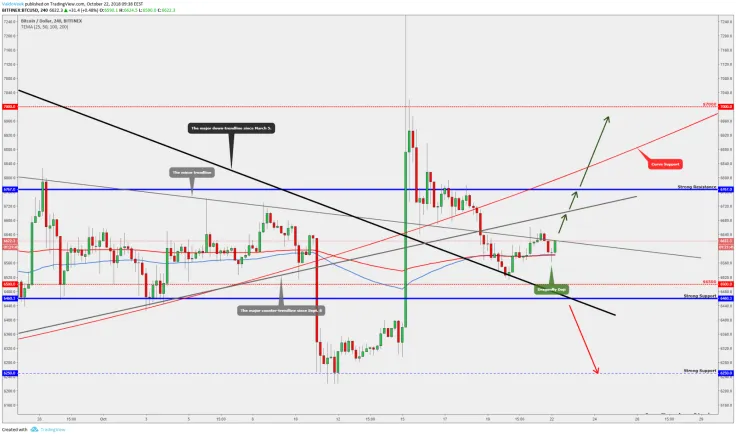
Let’s look at this a little bit deeper into the four-hour time frame. The first thing we discover is the 100 and 200 EMA which work currently as a strong support level because they are almost at the same price level. The last four-hour candle close gave us “Dragonfly Doji” which will indicate that the price will go higher — the price got rejected from EMA’s and formed a bullish candlestick pattern.
Now, if the four-hour candle closes like this, it would be another candlestick pattern called “Morning Star.” It consists of three candles and is a bullish candlestick pattern. Currently, it has a nice support, and if the close happens as we’ve mentioned, it would be a good indication that we can break the minor trendline and after that some higher levels.
The four-hour chart
Higher levels resistances:
- After the minor trendline break, the price has to fight with the major counter trendline which is pulled from Sept. 8. After last Thursday’s breakout downwards, it started to work as a resistance.
- The major resistance is the blue line at $6,767. This is the main area where we have to watch what the price action offers. If we want to see a bullish week from BTC, we just have to take down that resistance. In order to get there, we have to break the minor trendline first, the major counter trendline second and then the aforementioned price level of $6,767. The first target after the blue line breakout is around $6,900–$7,000. The road to there is not easy but is definitely possible (remember the “Inverted Hammer” candlestick pattern on the weekly time frame).
Lower levels supports:
- If we can’t find enough power to go upwards from EMA’s and fall below those, then the first support is the round number $6,500.
- Not far from the round number is the major down-trendline which still works as a support, but you have to watch it precisely from the weeks since March 5.
- The strong support (the blue line) at $6,460.
These three supports make a very strong crossing area which is hard to beat. However, if a candle closes (at least four-hour candle) below the last support level, stay away from the market because we can see a big movement there.
Ethereum price forecast
The weekly chart:
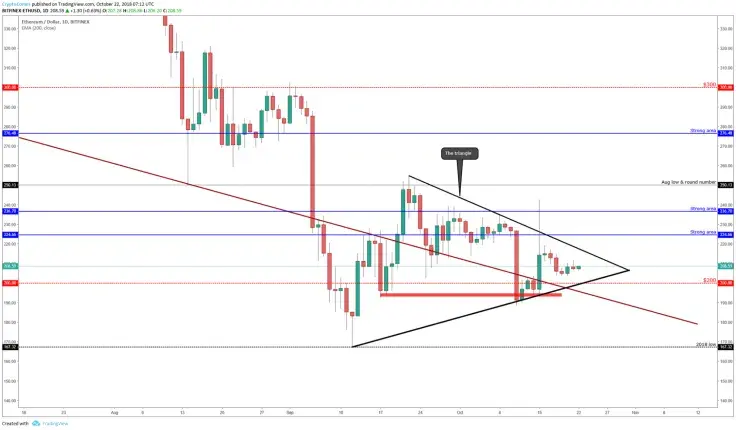
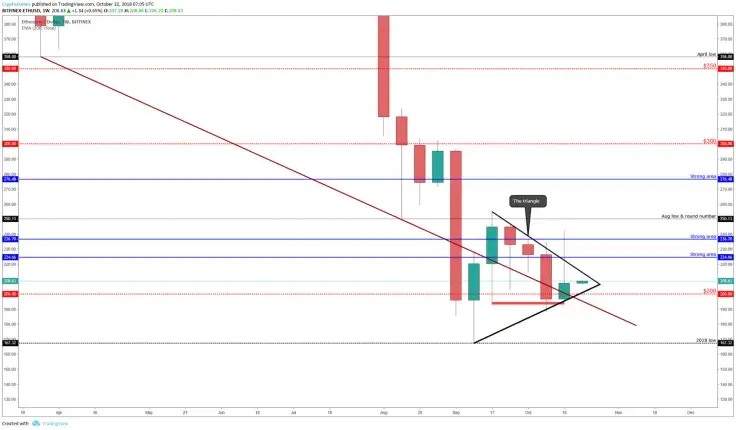 Like Bitcoin, on the weekly chart, Ethereum shows the same bullish candlestick pattern called “Inverted Hammer.” Last week, Ethereum got rejected from $240 and fell back into the triangle. The triangle has been there since September, and after the breakout from either direction, it is easier to say where the price wants to go.
Currently, it has found a support from the round number at $200, from the brown trendline which is pulled from March and from the triangle bottom trendline crossing area (together they make a very strong support).
The daily chart
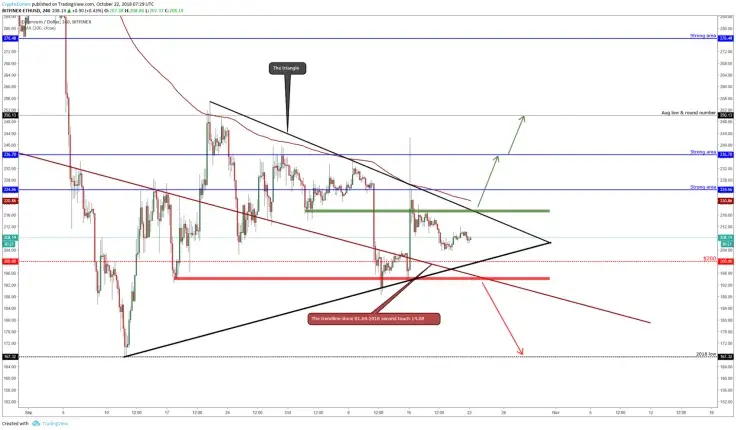
The daily chart shows that Ethereum still makes the lower highs, but in the bigger picture, we manage to hold that higher low which was made on Oct. 11. Those lower highs and higher lows allow drawing the trendlines (upper and bottom) which together make the Triangle. Last week ETH was rejected from the triangle upper trendline and from the two strong resistances (the blue lines at $224 and $236). Soon we will see a bigger movement because we are approaching the triangle tip, where the price is ‘smashed’ together and is ready to make a big move. The four-hour chart provides confirmations of which direction the price will follow.
The four-hour chart
Bullish scenario:
- To be bullish we have to get support from the market and from the bullish Bitcoin. If Bitcoin makes a breakout from the $6,767, then ETH has an opportunity to make a breakout from the triangle (upwards). So, the first big bullish sign is the four-hour candle closed above the triangle upper trendline.
- The second confirmation comes from the EMA 200. If the price reaches into the triangle trendline, then the 200 EMA will match exactly with this and they make together a strong resistance area.
So, a close above the trendline and the 200 EMA should guide us to the higher levels. The first targets will be the higher resistance at $236 and the August low — the round number — at $250.
Bearish scenario:
- A close below the round number $200.
- A close below the triangle bottom trendline which is currently also the major counter trendline.
- A close below the brown trendline which is pulled from March.
As we’ve said before, those criteria make a very strong price level which is hard to beat, but if a candle closes below the red line, stay away from the Ethereum, because after that it will probably be approaching the 2018 low level of $167.
Litecoin weekly price forecast
The weekly chart
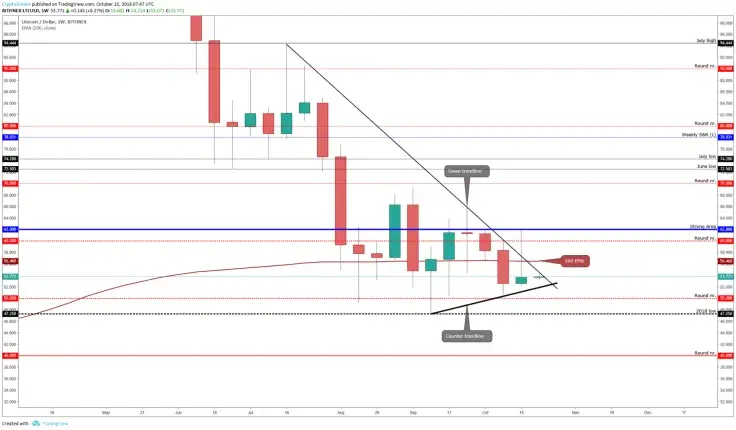
If we watch it from the candlestick perspective, Litecoin is not an exception and has also got the “Inverted Hammer.” The last week pump guided us to the $62 where we got rejected back below the 200 EMA. It’s possible we’ll see a movement this or the next week because the price is in the trendlines crossing area tip and is ready to make a move. The move depends on the market because altcoins don’t move without Bitcoin, they need a support from the whole market and from the BTC. The price movement allows drawing two clean trendlines — the down-trendline and the counter trendline. If we want to know which direction is more favorable, we have to dig into the lower time frames.
The daily chart
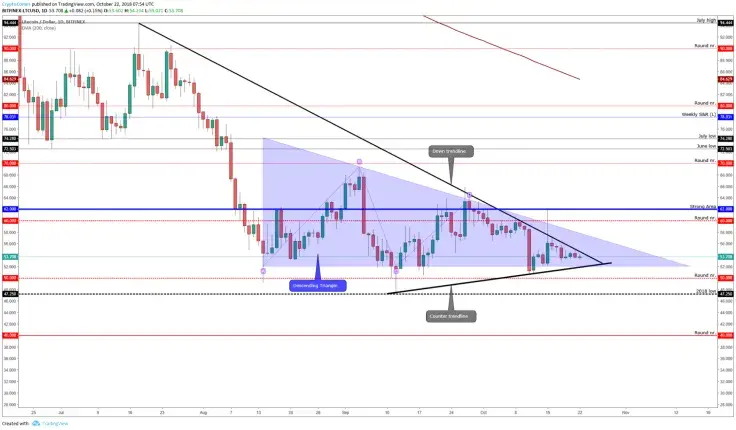 On the daily time frame, we can see that the down-trendline has worked perfectly as a resistance. The price got rejected from the trendline multiple times, and from that we can say this is currently the major resistance that the price has to take down to go higher.
The daily time frame also offers us a bit sloppy bearish chart pattern called “Descending Triangle.” It is still the triangle, and the price has opportunities to breakout either direction but a more favorable one is a breakout downwards. So far we’ve got mixed signs — a bullish candlestick pattern on the weekly chart and the bearish pattern on the daily chart. Let’s find some confirmation areas of both scenarios.
The four-hour chart
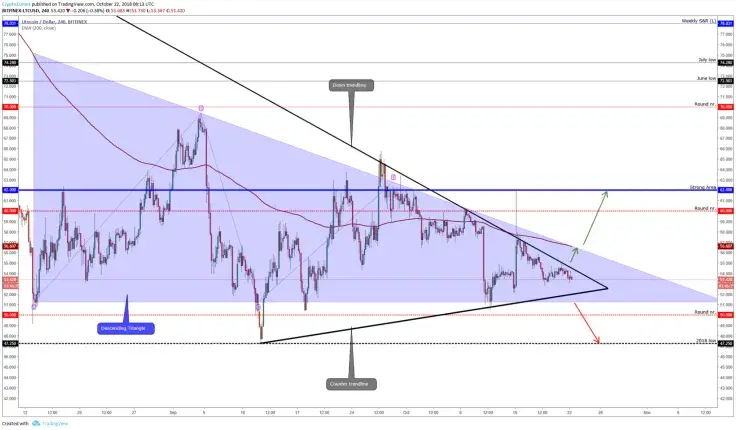 Let’s play both scenarios that could possibly happen this week because the price is very close to the trendlines crossing area which indicates that the explosion is on the way.
Bullish scenario:
- The price has to break above the down-trendline which worked as a strong resistance. It would be the first bullish sign if the price manages to stay above that trendline.
- A breakout from the trendline guides us to the sloppy “Descending Triangle.” This is the minor resistance, but we count this as a resistance because the 200 EMA is also in this area.
If the explosion occurrs, the major target will be the super-strong area at $62.
Bearish scenario:
- Break below the counter trendline.
- Break below the “Descending Triangle.”
Those criteria indicate that the price may go and retest the 2018 low at $47. If we get a breakout downwards, the sloppy “Descending Triangle” starts to work and will guide the movements into the lower prices. So, be ready and alerted if this scenario is on the chart!
 Dan Burgin