
The recent situation on the Bitcoin chart has started to signalize the possibility of an upcoming major bullish trend. The ultimate signal appeared yesterday and was confirmed today by the candle that opened above the resistance.
The 200-day moving average cross is the signal of a trend reversal that is used in various trading strategies and systems as the determination of the current trend direction.
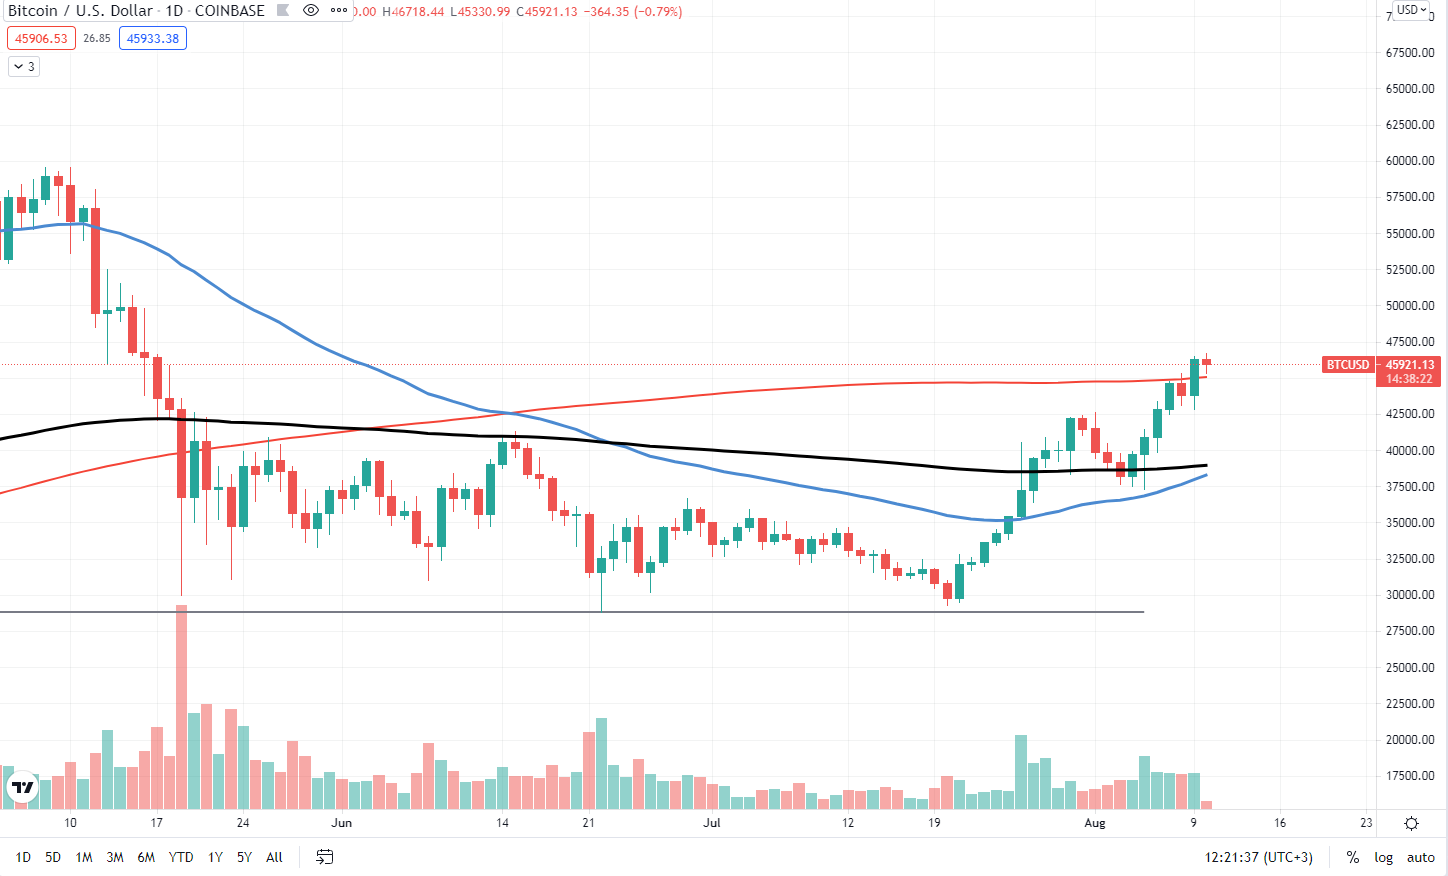
As for now, Bitcoin is consolidating right above the mentioned line. The final confirmation of the breakthrough will be the closing of two or more candles above the line.

In addition to the simple moving averages, the exponential moving averages with arguments of 50 and 200 are coming closer to each other and soon may or may not form another bullish signal for the market: 200/50 EMA cross. After the previous bearish cross Bitcoin went to the strong support with a 16% price drop.
In the last 20 days, Bitcoin’s price has risen from a “bottom” price of $27,500 and gone straight up to $45,000 without any major consolidation despite the “bearish” news that has appeared recently.
 Dan Burgin
 U.Today Editorial Team