
Disclaimer: The opinions expressed by our writers are their own and do not represent the views of U.Today. The financial and market information provided on U.Today is intended for informational purposes only. U.Today is not liable for any financial losses incurred while trading cryptocurrencies. Conduct your own research by contacting financial experts before making any investment decisions. We believe that all content is accurate as of the date of publication, but certain offers mentioned may no longer be available.
The decline that occurred over the weekend was not confirmed as bulls have seized the initiative. Bitcoin (BTC) has continued its rise after a short decline. Ethereum (ETH) has shown the biggest growth over the past 24 hours. The price of the leading altcoin has increased by 3.50% over the past day.
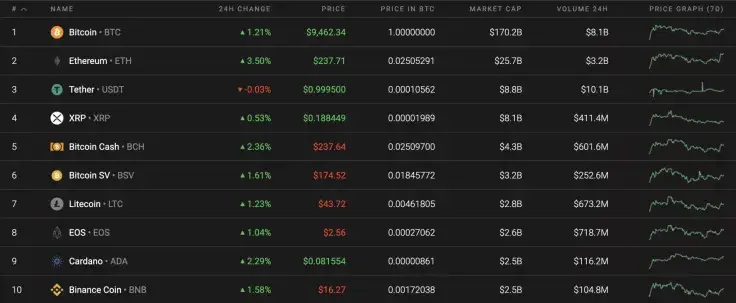
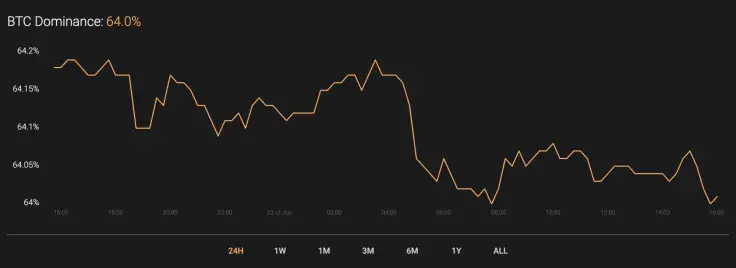
The rise of altcoins has affected the dominance rate of Bitcoin (BTC), which has slightly decreased and is now 64%.
The relevant data for Bitcoin is as follows.
-
Name: Bitcoin
Advertisement -
Ticker: BTC
-
Market Cap: $174,341,148,899
-
Price: $9,469.12
Advertisement -
Volume (24h): $17,374,785,198
-
Change (24h): 1.55%
The data is relevant at press time.
BTC/USD: Bulls are not giving up the initiative in the short-term
Last weekend, trading volumes remained below the average level, and the price of bitcoin was not able to come out of the sideways range. On Saturday, sellers pierced $9,200 and set a minimum at $9,138, and on Sunday morning, buyers tried to gain a foothold above the two-hour EMA55.
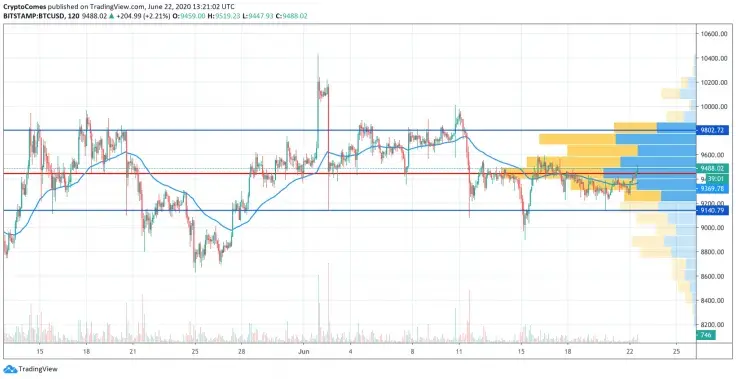
Low volumes of purchases did not allow the price to reach the level of 38.2% Fibonacci, and by the end of the day the pair rolled back to support at $9,300.

During the Asian session, buyers suspended the price of Bitcoin (BTC) above the average price level and today purchase volumes began to increase. The pair will break through the $9,441 level, and by the end of the day, it might test the resistance at $9,800.
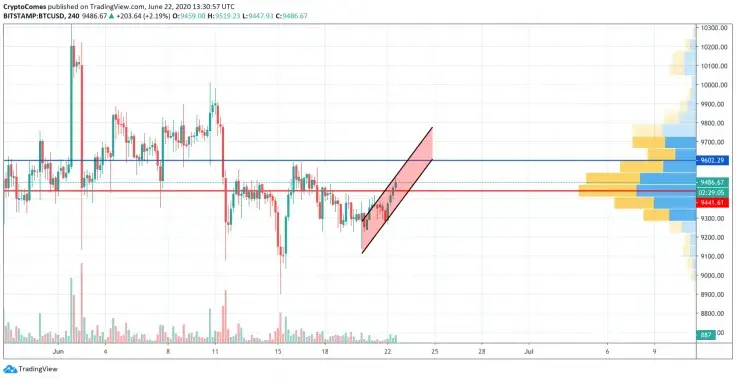
On the 4H time frame, the sideways trend has been changed by the ongoing growth as Bitcoin (BTC) bounced off the support at $9,200. Currently, it is trading within a narrow rising channel supported by medium trading volume. The next vital level is the resistance at $9,600. If the rise continues, buyers might attain that level by the end of the week.
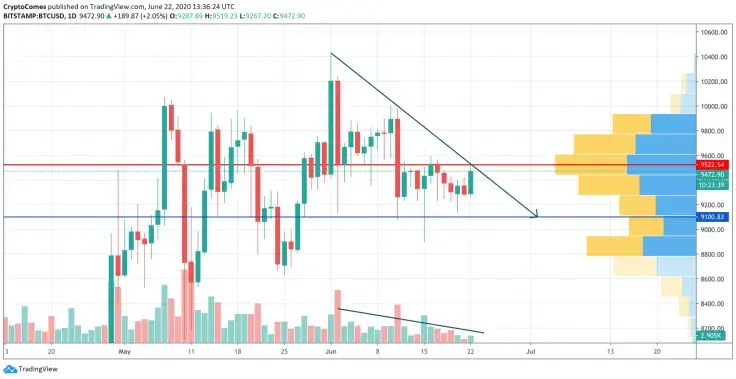
According to the daily chart, a chance to retest $9,100 still remains. First of all, buyers lack the strength to set new local heights as the trading volume is low. In this case, after a bounce back to the $9,600-$9,700 zone, there might be a sharp decline to $9,100. Bears might reach the said support level by the end of the current month.
Bitcoin is trading at $9,462 at press time.
 Dan Burgin
 U.Today Editorial Team