Disclaimer: The opinions expressed by our writers are their own and do not represent the views of U.Today. The financial and market information provided on U.Today is intended for informational purposes only. U.Today is not liable for any financial losses incurred while trading cryptocurrencies. Conduct your own research by contacting financial experts before making any investment decisions. We believe that all content is accurate as of the date of publication, but certain offers mentioned may no longer be available.
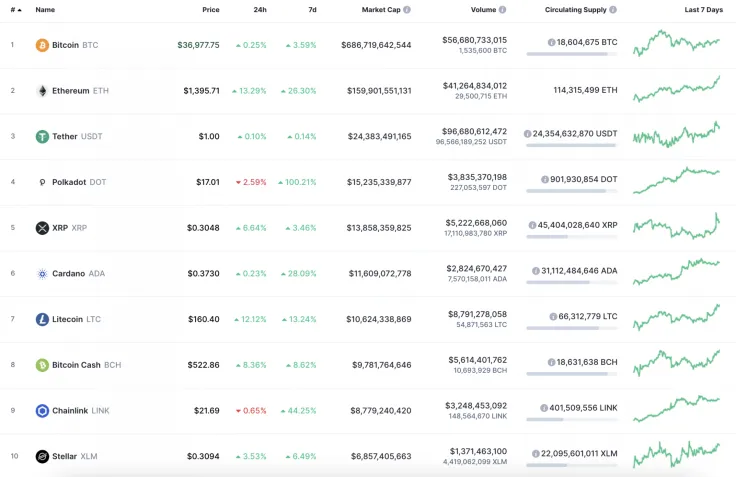
The bullish mood continues on the cryptocurrency market. However, there are some exceptions to the rule. Mainly, Polkadot (DOT) and Chainlink (LINK) are in the red zone, falling by 2.59% and 0.65%, respectively.
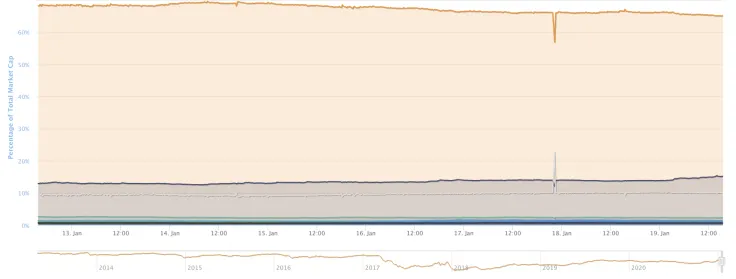
As altcoins are growing faster than Bitcoin (BTC), the market share of the leading crypto keeps going down and is now 65.2%.
The relevant data for Bitcoin is looking the following way:
-
Name: Bitcoin
Advertisement -
Ticker: BTC
-
Market Cap: $687,708,580,684
-
Price: $37,029.80
Advertisement -
Volume (24h): $56,770,489,907
-
Change (24h): -0.90%
The data is relevant at press time.
BTC/USD: Is the accumulation period coming to an end?
Yesterday, buyers' attempts to gain a foothold above the hourly EMA55 were repeated and, by the end of the day, they managed to stay above the level of average prices. The daily maximum was recorded around $37,450.
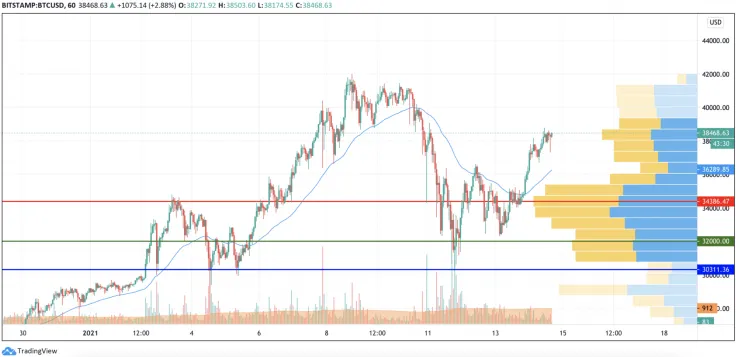
On the hourly time frame, one can distinguish the level of $37,300, which is currently holding back the recovery of the Bitcoin (BTC) price. If, today, the line at around $36,000 works as a support, then the recovery may continue to the resistance of $40,000.
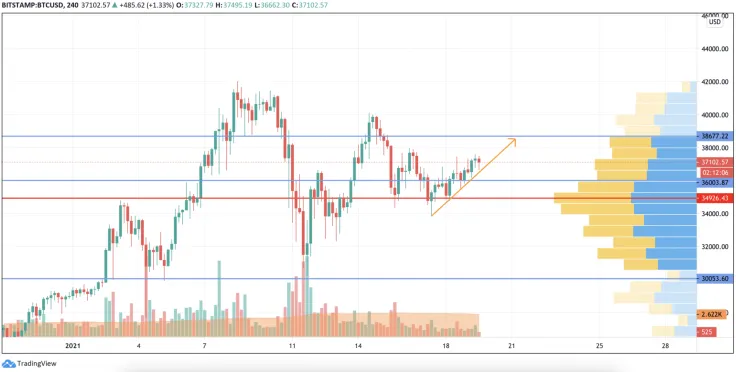
On the 4H time frame, Bitcoin (BTC) is on the way to the local resistance at $38,600. The leading crypto has accumulated enough energy to reach that level, however, it was not enough to set the new peak.
It is also confirmed by the low buying trading volume.
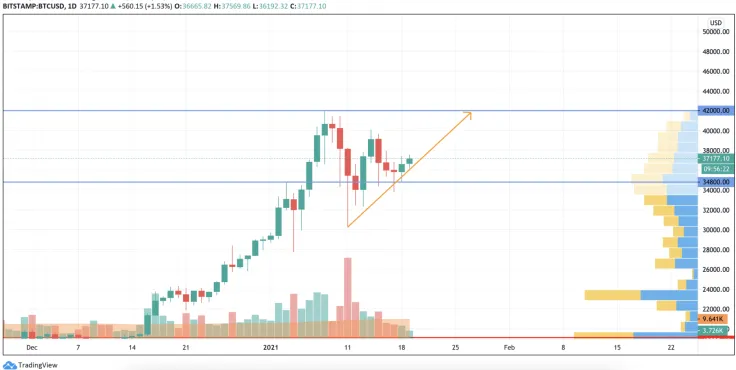
The bullish price action is also on the daily chart with a target at $42,000. However, the trading volume should increase if bulls want to attain that level. The same is applied to liquidity, which is low at current levels.
Bitcoin is trading at $37,087 at press time.
 Yuri Molchan
 Arman Shirinyan
 Alex Dovbnya