
Disclaimer: The opinions expressed by our writers are their own and do not represent the views of U.Today. The financial and market information provided on U.Today is intended for informational purposes only. U.Today is not liable for any financial losses incurred while trading cryptocurrencies. Conduct your own research by contacting financial experts before making any investment decisions. We believe that all content is accurate as of the date of publication, but certain offers mentioned may no longer be available.
The market is recovering slowly, mostly dominated by volume. Today, in the absence of strong bearish pressure, prices may return to the zone of June highs.
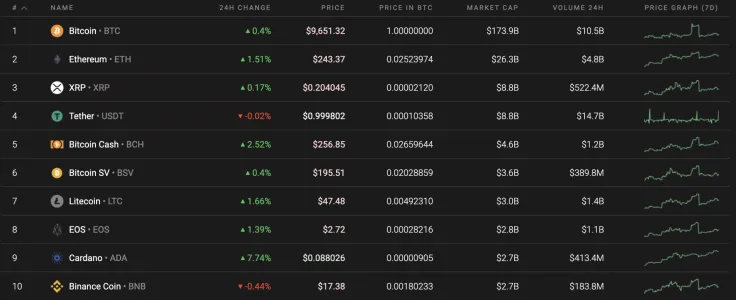
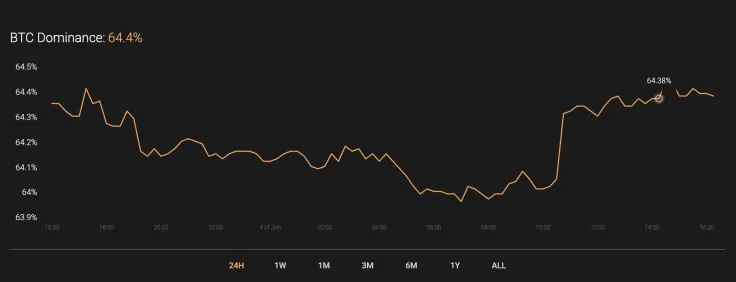
Meanwhile, the dominance rate of Bitcoin (BTC) has remained almost unchanged over the past day and is now 64.4%.
The relevant data for Bitcoin is as follows.
-
Name: Bitcoin
Advertisement -
Ticker: BTC
-
Market Cap: $177,927,669,653
-
Price: $9,673.17
Advertisement -
Volume (24h): $2,117,227,175
-
Change (24h): 0.62%
The data is relevant at press time.
BTC/USD: Will the Return to $10,000 be fast?
Days earlier, bears once again drove the price down from an important resistance level. The values of the RSI indicator also pushed off the resistance. As for the main trading idea, one can expect a rebound from the upper border of the downward channel and a drop in cryptocurrency quotes to $6,500. In this area, the completion of the “Inverted Head and Shoulders” pattern will be possible.
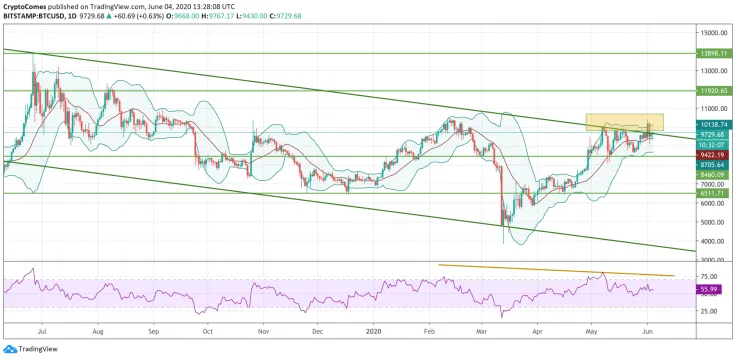
A confirmation of the drop in the value of Bitcoin (BTC) will be a breakdown of the support level and the price holding below $8,415.

Another likely scenario is a breakdown of the upper boundary of the downward channel with the price holding above $10,565. This will also indicate a halt in the development of the reversal model and continued growth to the potential target at $13,865.
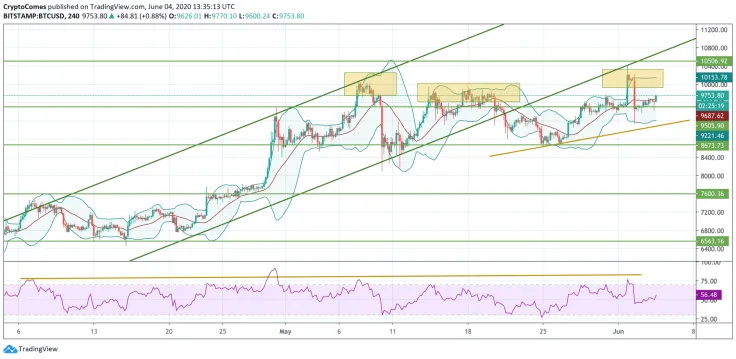
On the 4H chart, quotes pushed off the $10,000 level for the third time. The reluctance of the market to move higher may indicate pressure from sellers and the potential for a fall to the first target at $8,670. Another possibility is a breakdown at $10,565, indicating a way out of the upper boundary of the channel, which suggests accelerating the development of the uptrend.
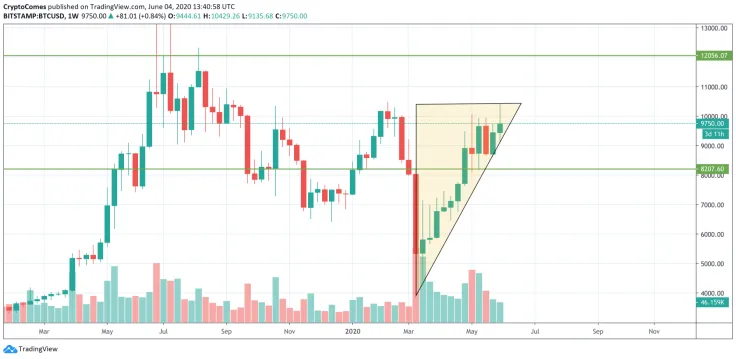
On the weekly time frame, Bitcoin (BTC) is stuck within the Triangle pattern. This shows the continued trend, which means that by the end of the month, there is a high chance of seeing the main crypto at the resistance around $12,000. However, it may happen only if the trading volume increases.
Bitcoin is trading at $9,747 at press time.
 Dan Burgin
 U.Today Editorial Team