Disclaimer: The opinions expressed by our writers are their own and do not represent the views of U.Today. The financial and market information provided on U.Today is intended for informational purposes only. U.Today is not liable for any financial losses incurred while trading cryptocurrencies. Conduct your own research by contacting financial experts before making any investment decisions. We believe that all content is accurate as of the date of publication, but certain offers mentioned may no longer be available.
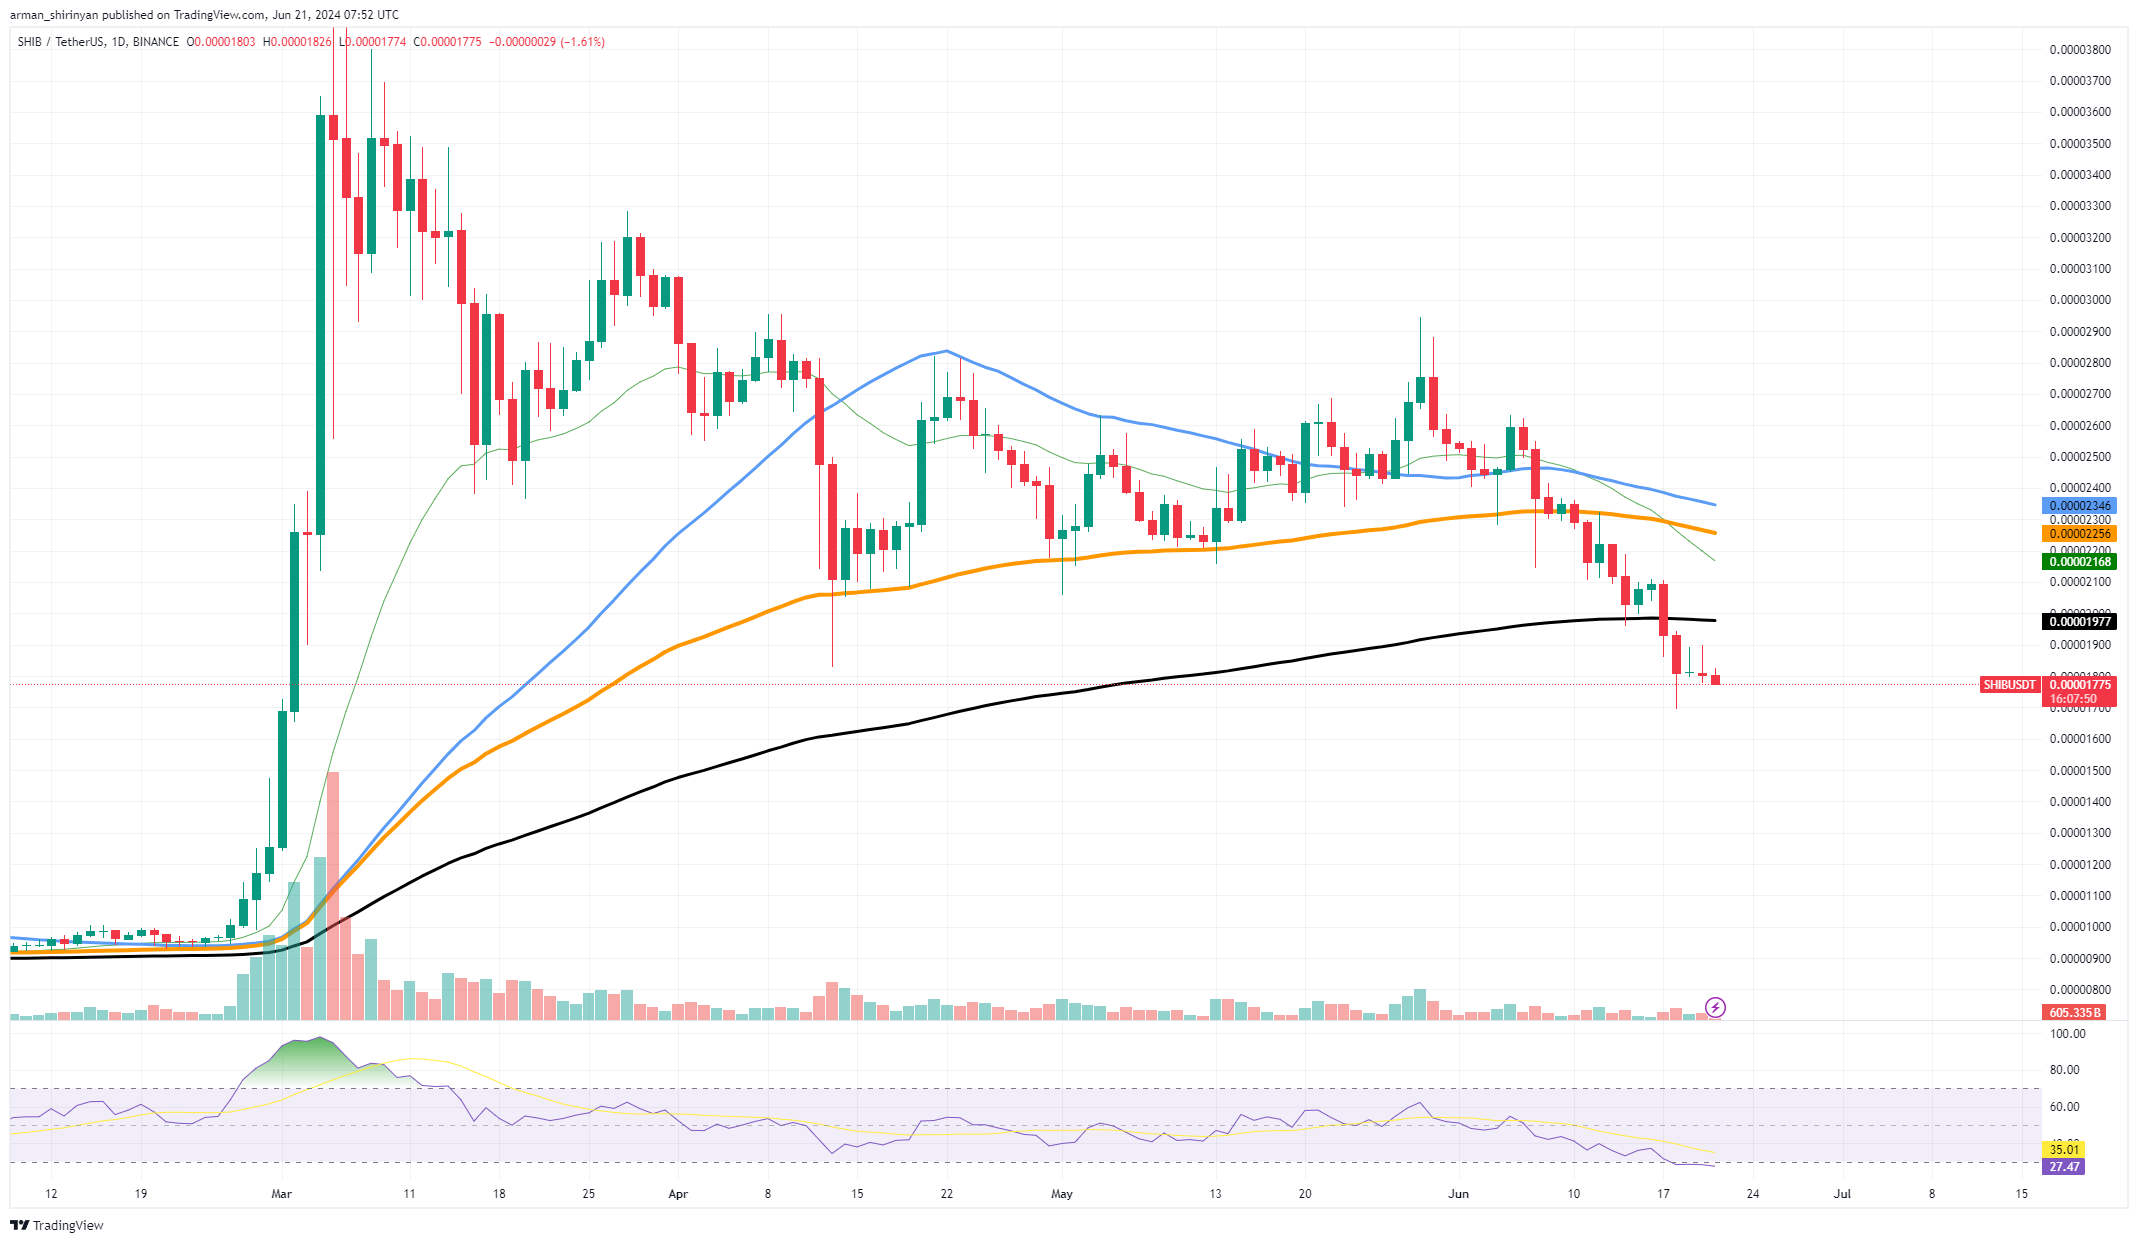
Shiba Inu is in a dire state after the most recent price plunge. However, things may turn around quickly; the cryptocurrency market is certainly known for that. The key levels to watch if you are trying to catch the falling knife will most likely be $0.000018, $0.000015 and $0.0000096. Let's discover why.
Since SHIB needs to reclaim the $0.000018 before it can exhibit any indications of a possible reversal, it is the first important level for the price to capture. Historically this level has provided consistent resistance as well as support. The current consolidation of SHIB at that level is positive.

The 100 EMA, a level that has shown to be a reliable support for Shiba Inu particularly on a weekly chart, is found at $0.000015. The assets performance may be fairly stable whenever SHIB rises above those thresholds. Any bullish momentum must be maintained above this level in order to halt additional losses.
The final significant long-term support level is $0.0000096. For SHIB this level acts as both a psychological barrier and a historical support threshold. Long-term investors and those who are not yet exposed to SHIB may find that now is a compelling time to buy, even though a dip to this level would indicate a significant retreat from recent highs. There's a good chance we'll see a big price reversal and a strong accumulation phase if the price bounces off this level.
The price movement on the SHIB/USDT charts indicates how important these levels are. SHIB has entered oversold territory as a result of the recent decline which is the first sign of a reversal as shown by the RSI falling below 40 on the daily and weekly charts.

 Alex Dovbnya
 Arman Shirinyan
 Denys Serhiichuk