Friday 26 started off for Ripple with consolidation in the corridor $0.29 - $0.30.
Now, it is too early to stay about any bounce back, as the quotes are trading below their local minima.
However, further decline may have been stopped due to the following reasons.
Ripple published a financial report for the first quarter of 2019, which refers to an increase in sales of XRP tokens by 31% compared to the previous quarter. Overall, the company sold tokens for $169.42 million.
One more cause is connected to the Binance exchange, which added the chance to purchase Ethereum, Ripple, Litecoin and Bitcoin Cash using credit cards through the application.
Now, let’s predict the XRP’s rate from the technical perspective.
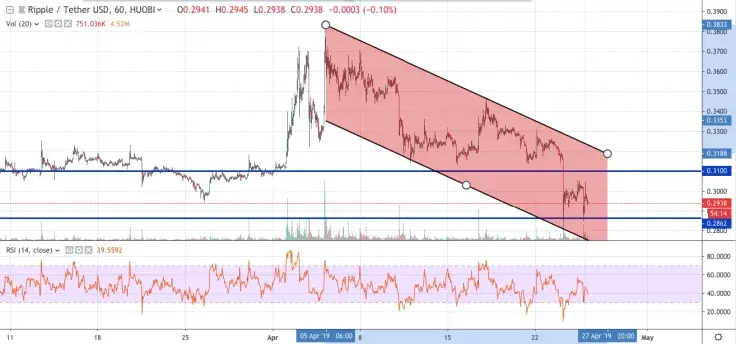
Analyzing the 1-hour graph, Ripple is struggling to test the psychological support level at $0.30, that bears broke yesterday but failed to fix it. The RSI indicator is located around the 40 mark, which is closer to the oversold zone.
A rise to $0.32 or above is unlikely to happen, as bulls need some time to gain their efforts and come back.
We can think about the potential trend change when the XRP touch $0.31.
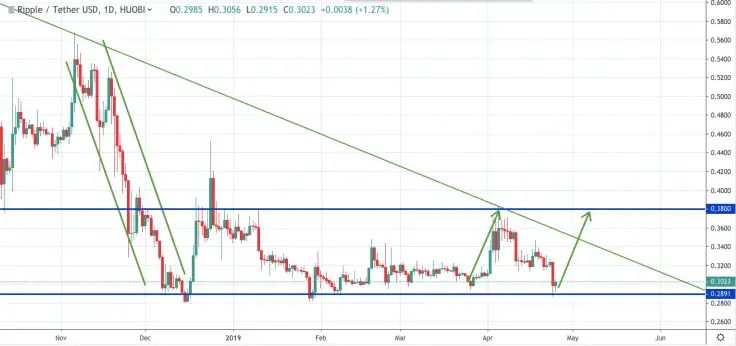
On the 1-day chart, Ripple has been facing the pressure of bears for more than 6 months. At the end of December 2018 buyers tried to push the price; however, in the end, sellers decreased the rate to $0.30.
The critical zone which signs of a long-term trend change is $0.38., the break of which means that bullish trend is replaced by bearish.
 Dan Burgin
 U.Today Editorial Team