
Disclaimer: The opinions expressed by our writers are their own and do not represent the views of U.Today. The financial and market information provided on U.Today is intended for informational purposes only. U.Today is not liable for any financial losses incurred while trading cryptocurrencies. Conduct your own research by contacting financial experts before making any investment decisions. We believe that all content is accurate as of the date of publication, but certain offers mentioned may no longer be available.
Tron has recently demonstrated significant market strength with a 15% rally. This surge comes amid news that Tron has become the preeminent blockchain for USDT transfers, highlighting its increasing utility and importance within the cryptocurrency ecosystem.
The price analysis of TRX shows a robust upward trajectory as the cryptocurrency has steadily climbed, breaking through key resistance levels. This pattern is underscored by Tron's ability to maintain its rally above the pivotal moving averages, which now serve as dynamic support levels.
The 50-day EMA has been decidedly breached and is now acting as support, currently sitting near the $0.11 mark. The maintenance of price levels above this EMA is a bullish sign, indicating that the market could continue to favor buyers in the near term.
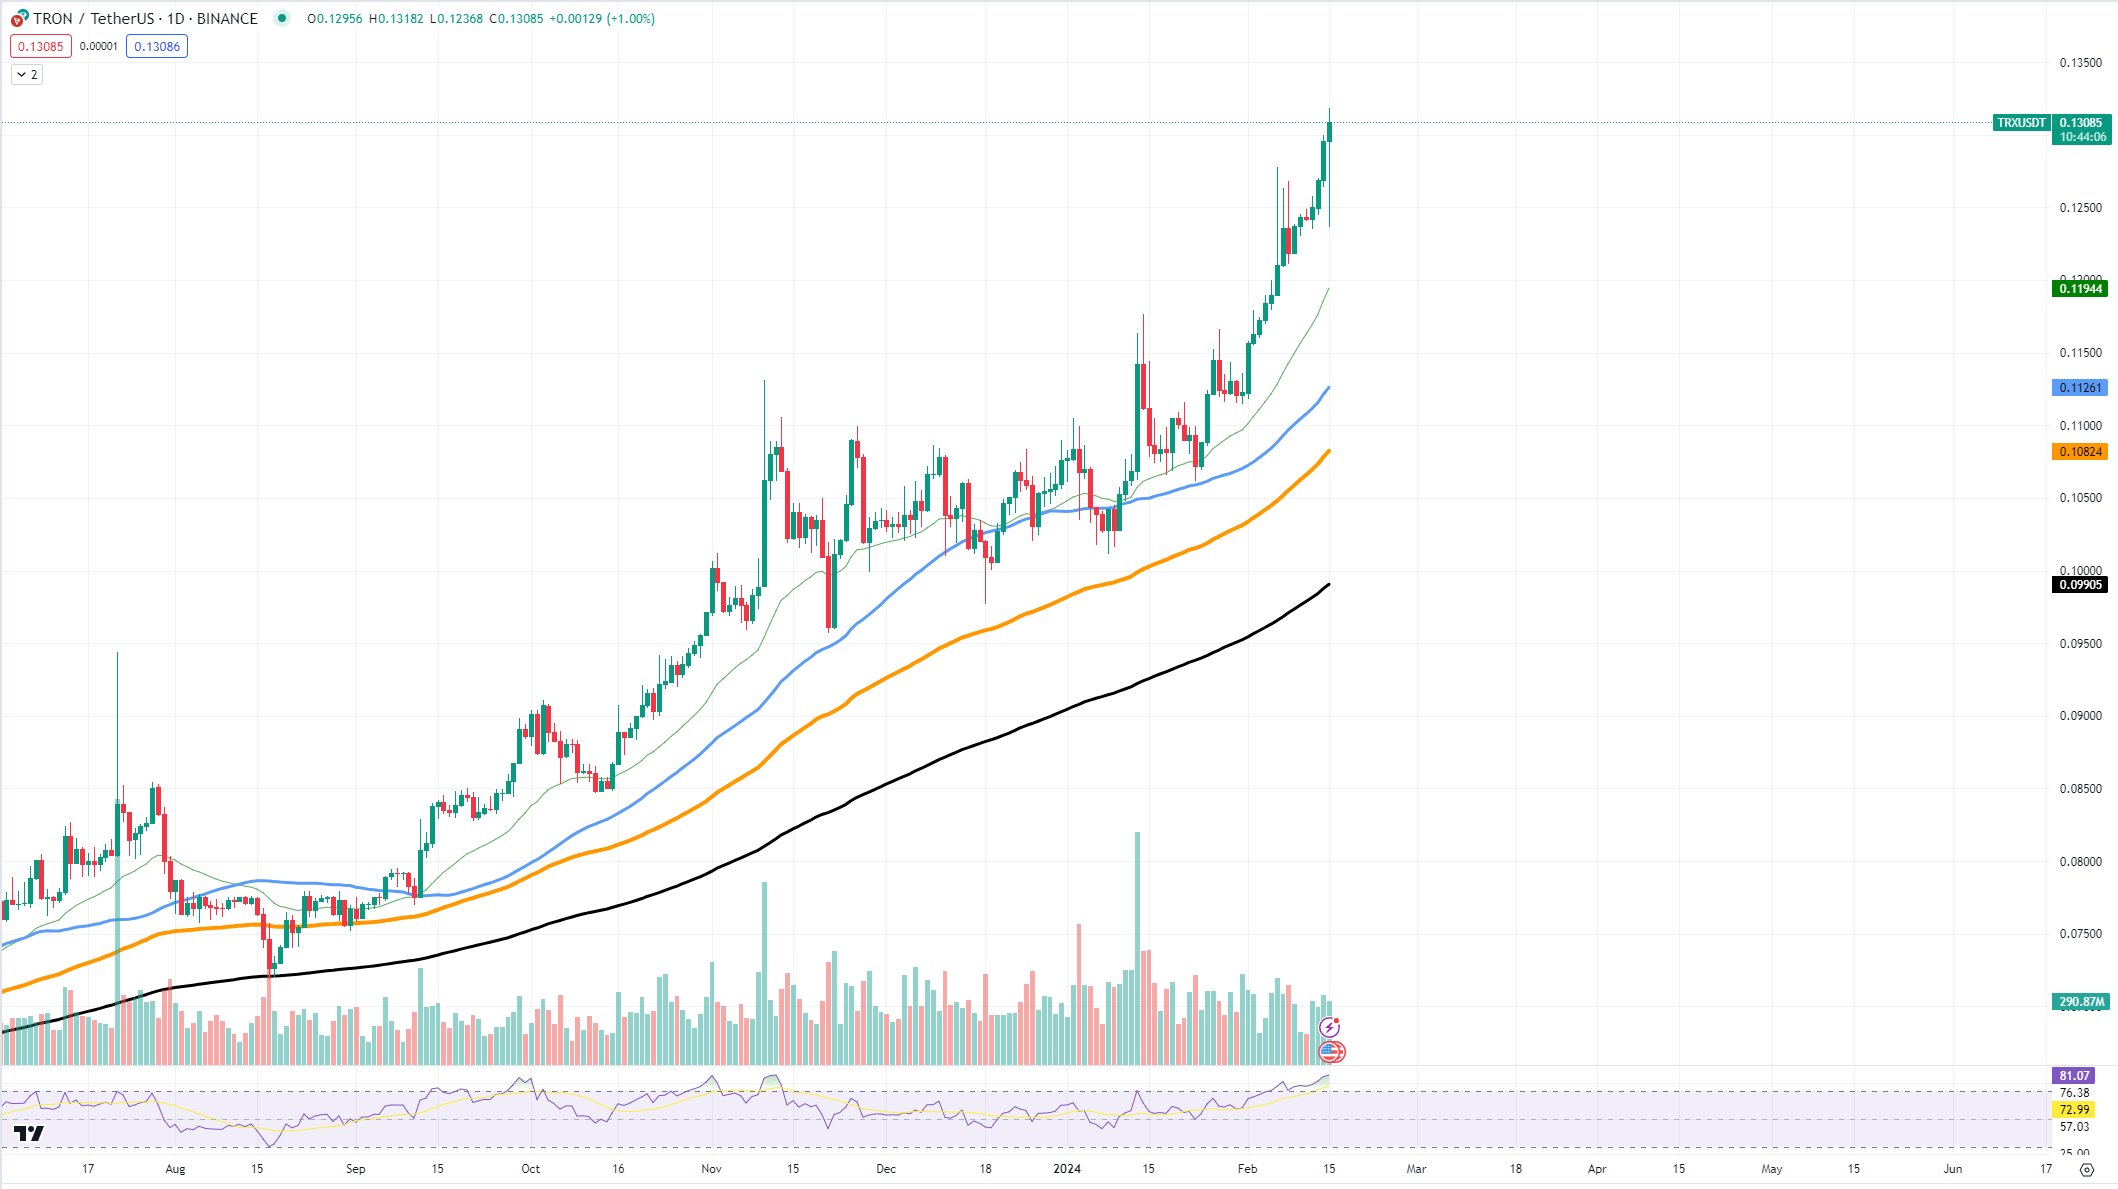
Observing the recent price candles, TRX has established a new resistance level at approximately $0.13, a price point that has been tested and not exceeded in recent trading sessions. A consistent close above this resistance level could signal a continuation of the upward momentum, with the next psychological barrier likely residing around the $0.14 to $0.15 range.
Cardano breaks out
Cardano has recently secured a significant breakthrough, having surged past the 50-day EMA on its daily chart. This technical achievement is a bullish indicator and often signals a potential continuation of upward price momentum.
The 50-day EMA is a widely watched technical indicator that smooths out price data by creating a single flowing line, which makes it easier to identify the direction of the trend. A breakthrough above this line suggests that buyers are gaining control, and the market sentiment around ADA is turning increasingly positive.
A closer look at the price chart reveals that ADA's price action has formed a solid base above the 50-day EMA, which now acts as a dynamic support level. This key level is currently situated around $0.50, a psychological threshold that often plays a role in trader decision-making. The ability of ADA to maintain its foothold above this level could attract further buying activity.

The recent price surge has also seen ADA overcome other resistance levels. The previous resistance, marked by a consolidation pattern just below the 50-day EMA, has now turned into support. This zone, at approximately the $0.48 mark, will be crucial to watch in the coming days as ADA seeks to maintain its bullish posture.
On the upside, ADA faces its next significant resistance around the $0.58 region. This level has previously acted as a barrier to price advances, and a decisive close above could pave the way for further gains. Beyond this, the psychological level of $0.60 looms large as a potential target for bulls.
Shiba Inu finally showing strength
Shiba Inu has recently marked a significant technical milestone, successfully breaking through the 50-day EMA and consolidating above this crucial resistance-turned-support level. This positive price action is accompanied by ascending trading volume, a confluence of factors that could be indicative of a firming bullish trend.

The break above the 50-day EMA provides a technical validation of increasing investor confidence in SHIB. The EMA acts as a dynamic level that smooths out price data over a specified period and is less reactive to sudden price changes than a simple moving average, making it a more accurate charting tool compared to a simple moving average.
As SHIB's price consolidates, the next significant resistance is projected at the local high reached prior to the breakout. If SHIB maintains its momentum and breaks past this next hurdle, it would signal a further strengthening of the market's upward trajectory.
 Dan Burgin
 U.Today Editorial Team