Disclaimer: The opinions expressed by our writers are their own and do not represent the views of U.Today. The financial and market information provided on U.Today is intended for informational purposes only. U.Today is not liable for any financial losses incurred while trading cryptocurrencies. Conduct your own research by contacting financial experts before making any investment decisions. We believe that all content is accurate as of the date of publication, but certain offers mentioned may no longer be available.
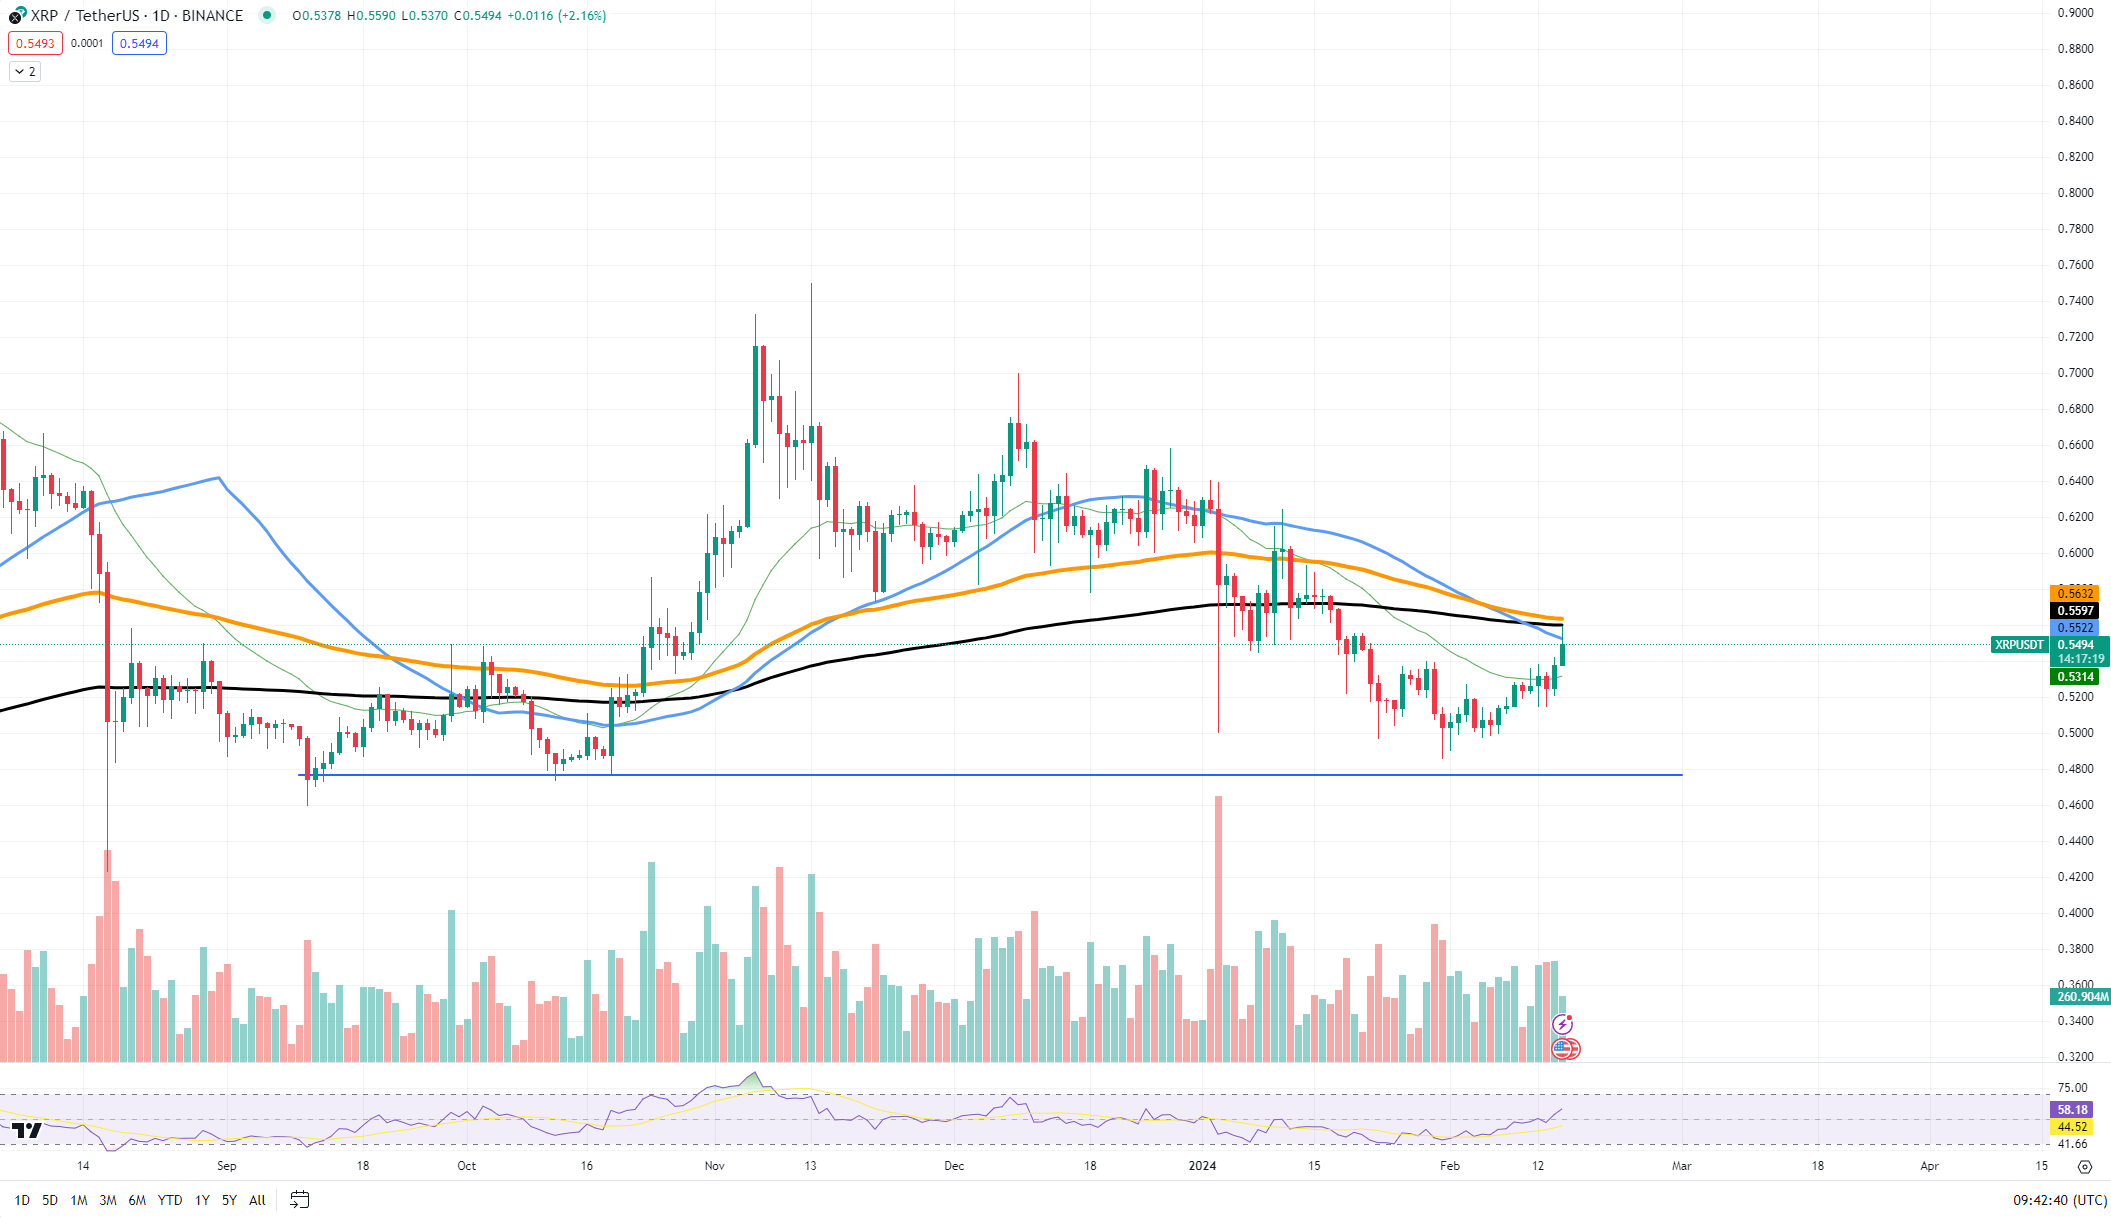
XRP has shown its first dramatic price action in 2024, with a significant wick indicating a potential bullish reversal. The recent XRP/USDT chart shows breaking through at approximately $0.54, suggesting that the digital asset may continue to push forward in the market. This breakthrough is particularly notable as it occurs near a historically critical price level, which could signify the beginning of a strong upward trend.
The chart reveals that XRP's price touched the 200-day EMA, a key indicator watched by traders for long-term market trends. However, the rapid reversal from this touchpoint is not typically what market enthusiasts would hope to see, as it often indicates hesitation on the market.

Despite this, the long wick left behind by the price reversal is a strong signal that buyers are stepping in to drive the price up, suggesting that selling pressure was overcome by strong buying interest.
As we analyze the current market structure, we are witnessing the formation of a potential bottom for XRP. This bottom formation is indicative of a turnaround from previous downtrends and could possibly lead to a "cup and handle" pattern, a classic bullish continuation pattern.
In terms of specific price levels, the support at around $0.50 is critical. This level has previously acted as both resistance and support, making it a key zone for XRP's price stability. On the upside, resistance is likely to be encountered near the $0.58 to $0.60 levels, where previous price consolidations occurred. A break above these levels would further confirm the bullish scenario.
The volume profile alongside the price action shows an increase in trading activity, particularly as the price wick occurred. This heightened volume during a bullish wick is a positive sign, indicating that there is market interest at these lower price levels and that buyers are willing to step in to support XRP.

 Alex Dovbnya
 Arman Shirinyan