

Disclaimer: The opinions expressed by our writers are their own and do not represent the views of U.Today. The financial and market information provided on U.Today is intended for informational purposes only. U.Today is not liable for any financial losses incurred while trading cryptocurrencies. Conduct your own research by contacting financial experts before making any investment decisions. We believe that all content is accurate as of the date of publication, but certain offers mentioned may no longer be available.
Solana has recently made what many investors and analysts are calling the most important breakthrough of 2024. The asset has successfully broken through a key trendline resistance that had been instrumental in keeping it in a downtrend for an extended period.
This breakthrough is particularly significant as it signals a potential reversal of the bearish trend that Solana has been experiencing. The crossing of this trendline could serve as a strong catalyst for future gains, infusing confidence among investors about the asset's upward trajectory. Following this key development, Solana is now facing the next challenge, which is the 26-day Exponential Moving Average (EMA).
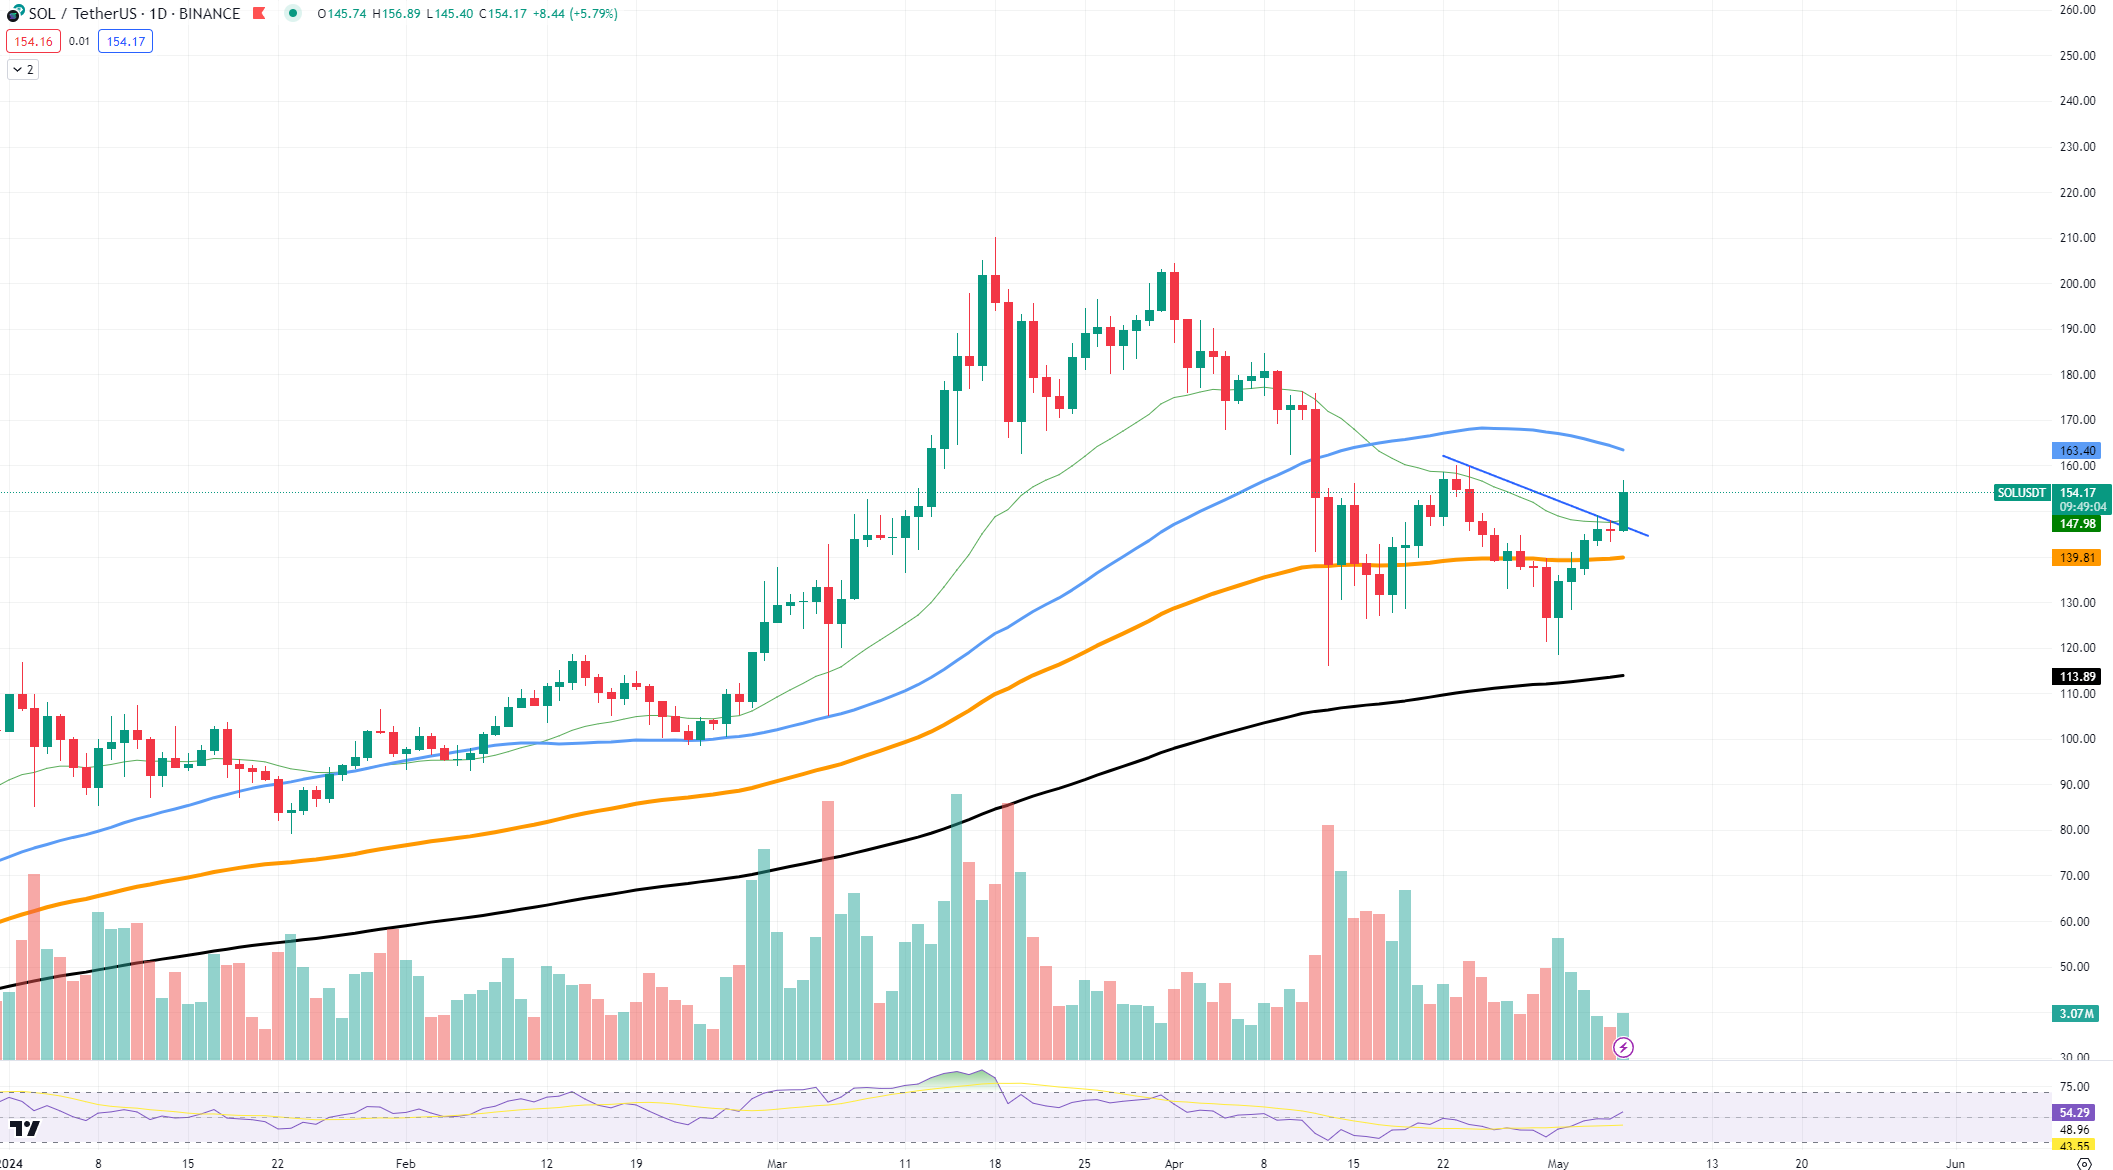
The 26 EMA has historically acted as a tough resistance level, and a decisive move above this could confirm the bullish momentum. Currently, Solana is trading around $146.82, with immediate resistance from the 26 EMA observed just above this price level. Overcoming this would likely open the path toward the 50-day EMA, which is situated around $163.29.
If Solana manages to sustain its position above these EMAs, it could further validate the strength of its current market recovery. This scenario not only reflects a significant technical victory but also potentially marks the beginning of a new bullish phase for Solana.
Ethereum is struggling
Ethereum is currently in a challenging phase as it contends with several crucial moving averages on its price chart. At present, ETH is striving to surpass the 26-day moving average, which is a short-term gauge of its price momentum.
The recent price chart indicates that after potentially overcoming the 26 CMA hurdle, ETH will face the next significant resistance at the 50-day moving average (AMA). These moving averages are key indicators watched by traders to assess potential reversals or confirmations in the market trend.

 Denys Serhiichuk
If Ethereum manages to break above the 50 AMA, it would likely pave the way for a move toward earlier highs around $4,000. This is not an all-time high for the cryptocurrency but represents a critical recovery point from previous sell-offs.
Turning to the volume, it appears to be stable, with no clear signs of an upward or downward trend, suggesting neutral market sentiment. Similarly, the Relative Strength Index, positioned at around 50, indicates a balanced condition between buyers and sellers without leaning toward an overbought or oversold market state.
At this level, the price of ETH is not demonstrating a clear directional trend and appears to be consolidating, moving sideways as it gathers strength for a potential upward movement. This consolidation phase is critical as it provides the market and investors time to align on the future direction of the asset.
On the chart, notable resistance can be seen at around $3,200, following the current level of approximately $3,120. Support, on the other hand, is established near the $2,900 mark, providing a cushion should any downward pressure emerge.
XRP's new pattern
XRP is currently in a symmetrical triangle pattern, showing a potential volatility surge in the foreseeable future. This technical formation often indicates a period of consolidation ahead of a significant price breakout in either direction.
At present, XRP's price hovers around $0.55, showing a delicate balance between supply and demand. The symmetrical triangle suggests that the asset is compressing and a breakout is imminent. The direction, however, remains unclear due to mixed signals from other technical indicators.

 Tomiwabold Olajide
A concerning development alongside the triangle pattern is the looming possibility of a "death cross." This occurs when the 50-day moving average crosses below the 200-day moving average, traditionally a bearish signal for traders. Should this event materialize, it could potentially accelerate a downtrend for XRP.
On the other hand, the formation of the triangle itself often precedes a reversal. This possibility suggests that if XRP can navigate through the turbulence of the death cross, there may be an opportunity for a bullish reversal. Support levels are currently found around $0.50, which has historically provided a bounce back point during bearish trends. Resistance lies near the $0.60 mark, a breach of which could set the stage for a move toward higher resistances.