Disclaimer: The opinions expressed by our writers are their own and do not represent the views of U.Today. The financial and market information provided on U.Today is intended for informational purposes only. U.Today is not liable for any financial losses incurred while trading cryptocurrencies. Conduct your own research by contacting financial experts before making any investment decisions. We believe that all content is accurate as of the date of publication, but certain offers mentioned may no longer be available.
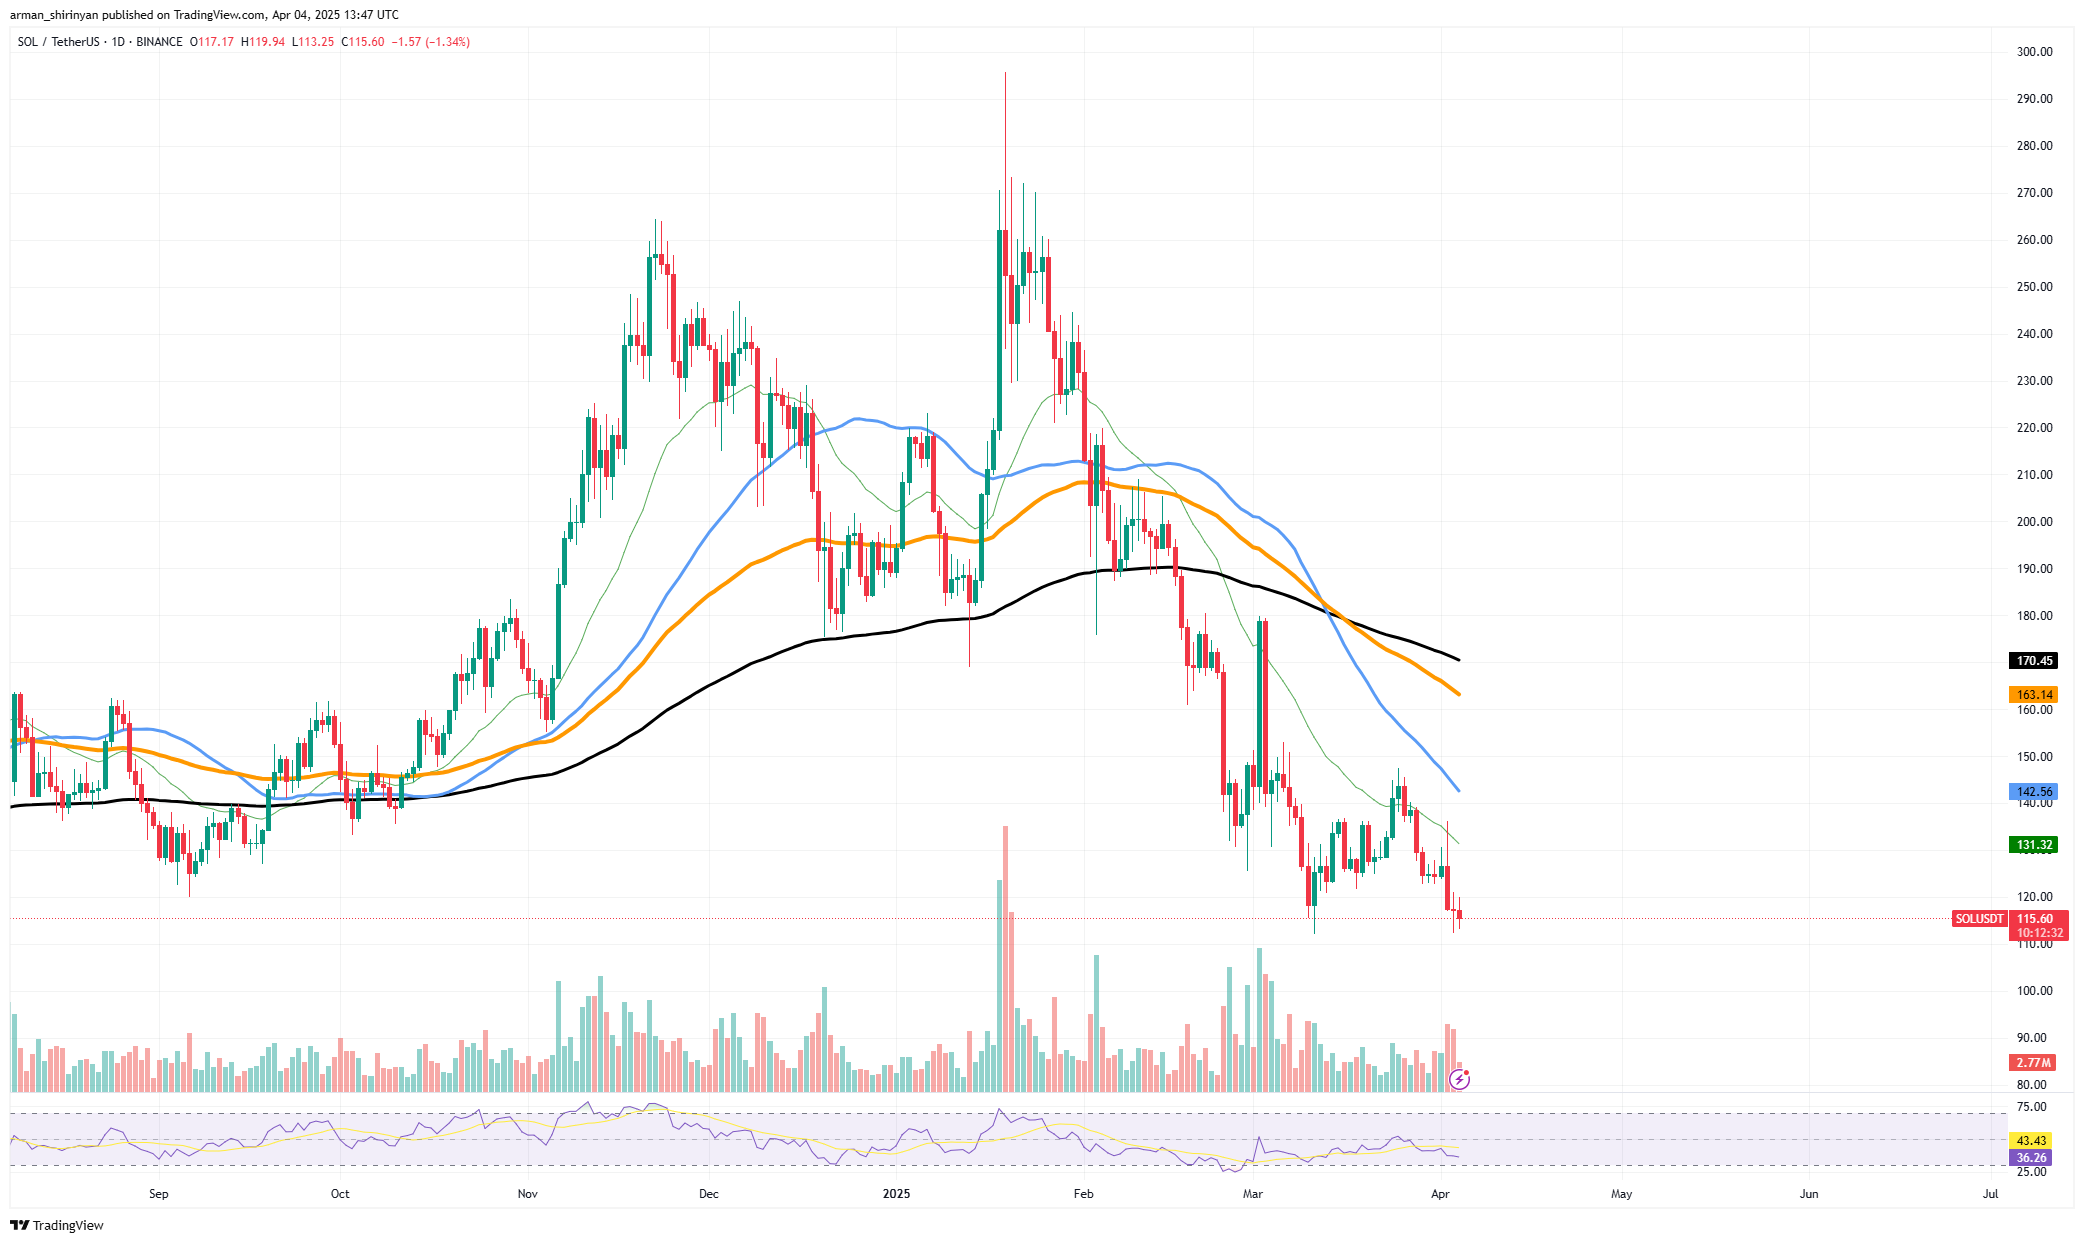
The market is becoming more bearish, and Solana is close to a pivotal psychological level. The asset looks perilously close to dropping below the $100 mark, which has not been reached in several months, with prices currently circling $120. For investors hoping for a swift recovery, the chart's lower low formation raises concerns about a sustained downward trend.
A particularly alarming indicator is the increase in bearish volume. The chart shows that red volume bars have been noticeably higher during recent trading sessions, indicating aggressive sell-offs by market participants. With no indication of accumulation or buyer support at the current levels, this increase in downside pressure indicates that bears are firmly in control.

Technically speaking, SOL has continuously failed to rise above its short-term moving averages, such as the 26 and 50 EMA, which are still sloping lower. The fact that the Relative Strength Index (RSI) has fallen below 45 indicates that Solana is more inclined toward oversold conditions, but it lacks the robust bullish divergence that usually denotes a reversal.
SOL should be closely watched at $100 if the selling pressure persists and it loses support at about $110. Panic-selling may increase a confirmed breakdown below that, which could pave the way for a decline toward $90 or even lower.
Is XRP getting ready?
Technical indicators are aligning for a possible reversal, and XRP looks to be preparing for a significant bounce. The asset recently retested the 200-day EMA, which is indicated in black on the chart. By remaining above this crucial level, it is demonstrating resilience. The 200 EMA has historically been a dynamic support level that frequently signals the start of bullish recoveries, particularly when price action levels out around it.
Since testing the $1.94 support zone, XRP has formed a higher low and is currently trading above the crucial psychological and technical level of $2.00, which may signal the beginning of a bullish trend. As buyers regain confidence and start to withstand downward pressure, the candles demonstrate a slow change in sentiment.
The volume profile lends more credence to this scenario. During green sessions, volume has begun to slightly increase despite being relatively moderate, suggesting an accumulation phase. The bullish argument could be strengthened by a persistent volume increase, which would also encourage XRP to retest the upper levels of its current descending wedge.
The next resistance levels to keep an eye on on the upside are $2.28 and $2.37, which were both once support zones but are now resistance. If these are broken, a big breakout from the wedge pattern might occur, which could push XRP back toward $2.60 and higher.
As the market moves out of oversold territory and into a more balanced trading environment, the Relative Strength Index (RSI) is also rebounding and is currently moving in the direction of the neutral 50 line.
Improved momentum indicators, increasing volume and the 200 EMA's strong hold suggest that XRP is ready for a significant recovery. A major rebound might be in the works if the asset keeps drawing bullish interest and the state of the world market holds up.
Shiba Inu recovery incoming?
After a protracted decline Shiba Inu is beginning to show early signs of recovery. Its most recent chart move indicates that the meme coin may finally be back in an uptrend — at least for the time being. The creation of a higher low, which represents a significant structural change on the chart, is one of the most obvious bullish signals today.
This phenomenon frequently marks the start of a trend reversal because it indicates that buyers are purchasing before new lows are reached and absorbing selling pressure. At $0.00001200, which has historically served as a crucial zone of accumulation, SHIB is currently holding firm above the important support level.
SHIB has recovered from this level to $0.00001244, indicating fresh interest in buying. The asset is also emerging from oversold conditions and moving into more neutral territory, as evidenced by the relative strength index (RSI), which is gradually rising and circling 44. An additional positive indication is the increasing volume during the most recent green candles.
This spike in volume demonstrates that the rebound is supported by significant market activity rather than merely a transient price change. Nevertheless, there is still a lot of fierce opposition to Shiba Inu. The 50 EMA is also serving as a dynamic barrier to additional upward momentum, and the next levels to keep an eye on are $0.00001300 and $0.00001357.
The argument for a long-term rally would be strengthened by a breakout above these levels. The current configuration provides a cautiously optimistic outlook even though SHIB's long-term trajectory is still unknown. We may see a more significant change in sentiment if bulls can sustain this momentum and break through adjacent resistance levels.


 Alex Dovbnya
 Denys Serhiichuk
 Caroline Amosun
 Tomiwabold Olajide