Disclaimer: The opinions expressed by our writers are their own and do not represent the views of U.Today. The financial and market information provided on U.Today is intended for informational purposes only. U.Today is not liable for any financial losses incurred while trading cryptocurrencies. Conduct your own research by contacting financial experts before making any investment decisions. We believe that all content is accurate as of the date of publication, but certain offers mentioned may no longer be available.
Shiba Inu paints a higher high on charts, signaling a potential reversal in investor sentiment and market dynamics. Following a period of consolidation, SHIB has broken past previous resistance levels.
SHIB's price has overcome a critical resistance level, now turning it into a support that traders should keep an eye on. This newfound support is situated around the $0.000022 mark. Should SHIB’s price retrace, this level could play a crucial role in sustaining the current bullish momentum. On the flip side, resistance lies near the $0.000028 level, a breach of which could pave the way for further gains.
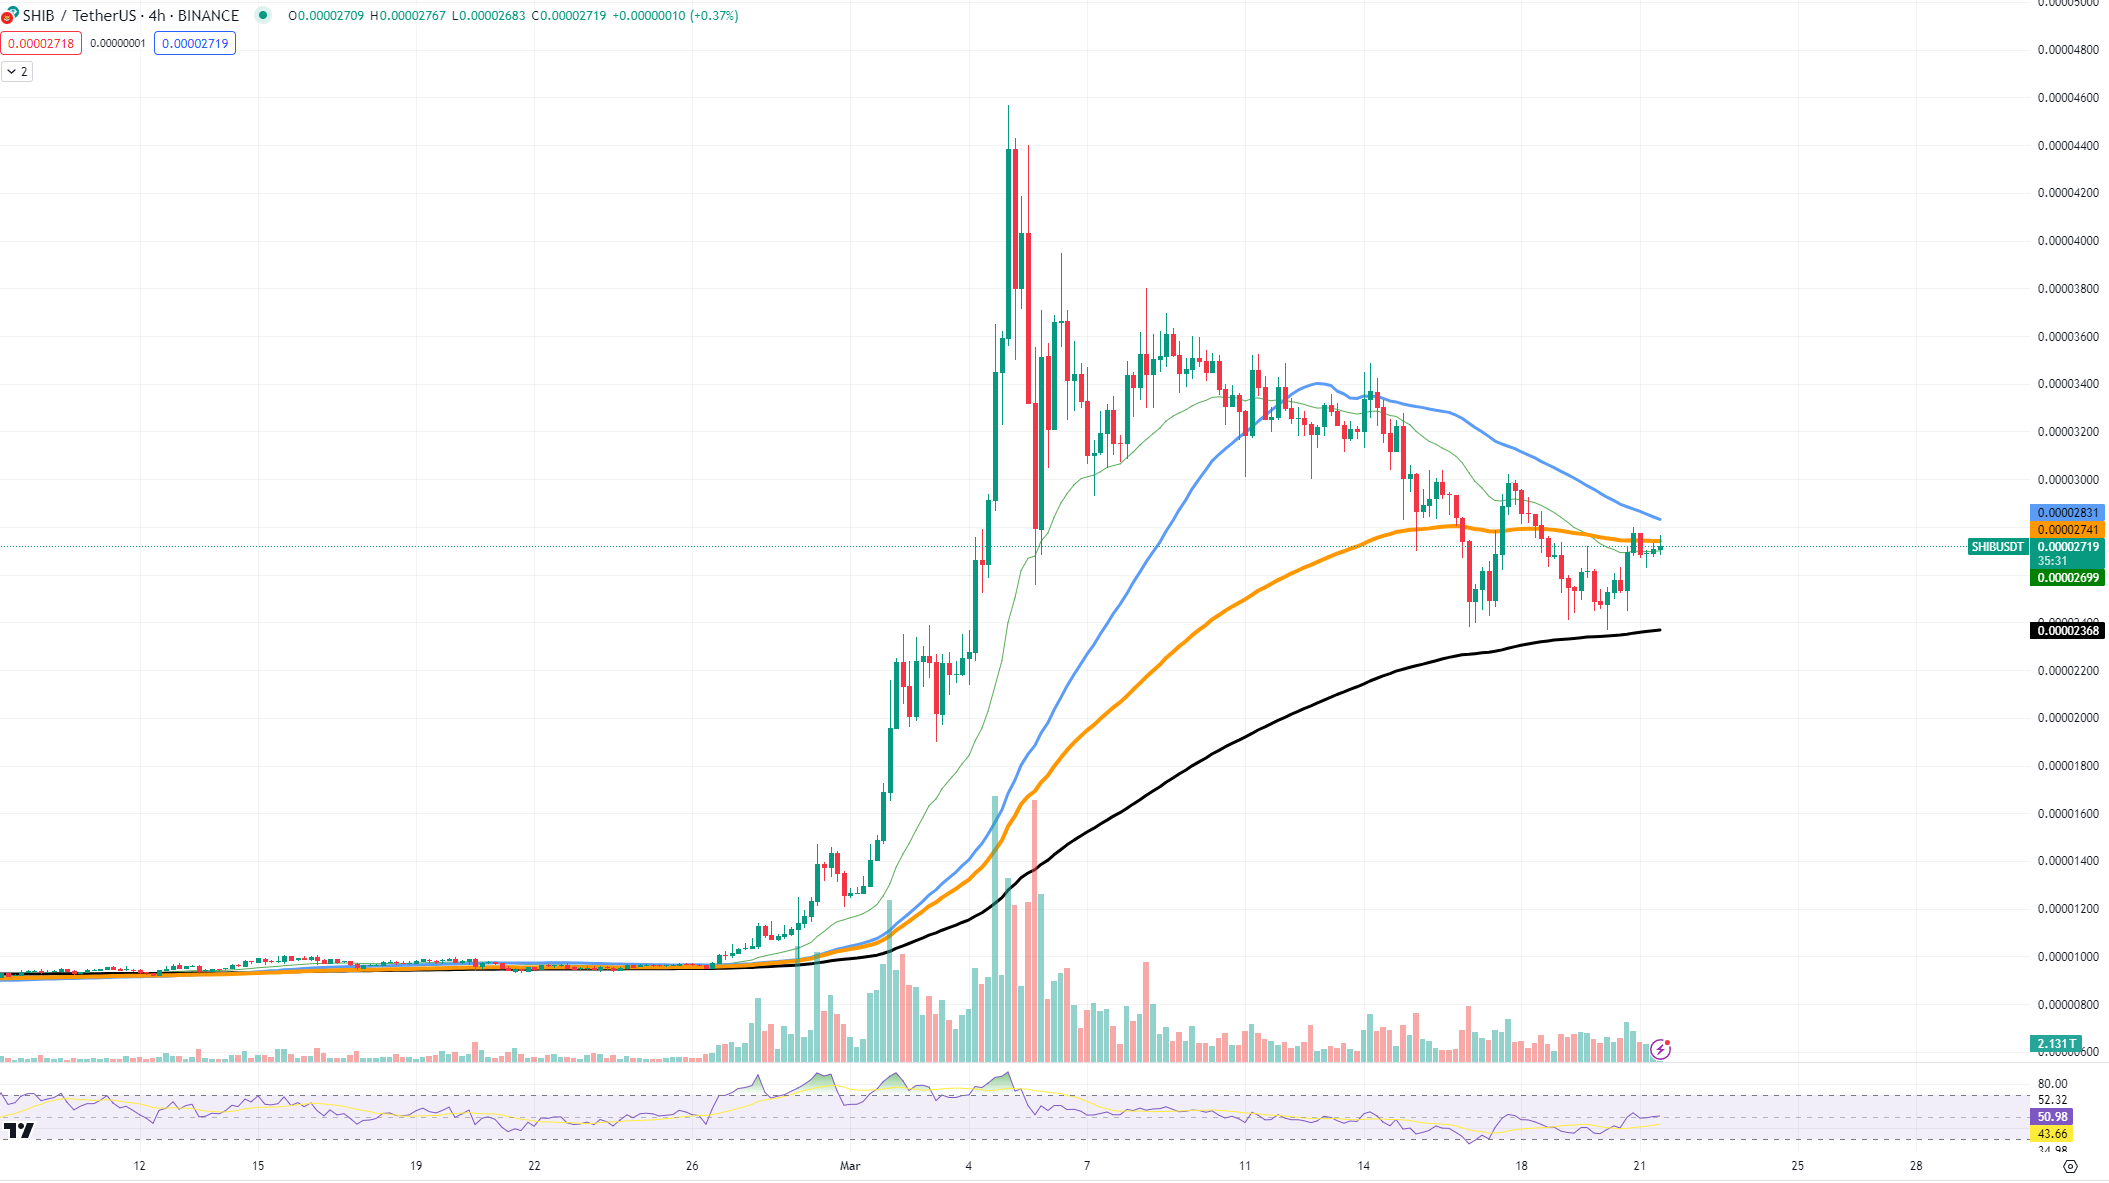
Shiba Inu has recently climbed to a new high, which is quite important. This shows that people are willing to buy more even when prices dip, suggesting they believe in the reversal in the foreseeable future. Before this, SHIB's price was consolidating, so this upward move has made those who like SHIB hopeful that its value could keep rising.
XRP secures golden cross
XRP has unexpectedly secured the golden cross formation. This occurs when a shorter-term moving average crosses over a longer-term moving average, typically indicating potential for significant price increases.
The daily price chart has shown the 50-day moving average climbing above the 200-day moving average, a substantial growth signal. The golden cross could potentially lead to an uptrend as it may attract more buying pressure.

The recent dip to the support level around $0.50 was met with a strong buy-back, pushing the price to a higher high. As another higher high gets painted, XRP might finally enter a prolonged uptrend and reverse for good.
In terms of growth scenarios, XRP could test and possibly break through the aforementioned resistance level. This would open the way to $0.70, and consolidation at around that price level would become a foundation for growth toward $1.
While the golden cross formation has historically been a reliable indicator of growth, it is not a guaranteed predictor of future price movements.
Bitcoin's hidden pattern
Bitcoin gives us something to talk about as the charts hint at a hidden pattern that could mean good news for investors. On the four-hour chart, an inverted head and shoulders pattern has formed, and this is often seen as a positive sign.
Looking closely at the numbers, Bitcoin has shown us a bottom, known as the "head," at around $62,430, which is a key level for Bitcoin. After that, it went up and came back down to form the "shoulders" at around $68,000, but not as low as the head. This is important because it shows that Bitcoin does not want to go lower than that head level.

What is exciting is that Bitcoin is now moving upwards, making what we call a "higher high." The price to watch is $64,433, because if Bitcoin can get past this point and stay there, it could herald the start of a big move upwards.
If we imagine the future for a bit, a growth scenario would be Bitcoin breaking past that $68,000 level. If it can hold its ground above that, the next stop could be looking toward $69,000, which would be a new challenge for Bitcoin to beat.
But remember, Bitcoin can be unpredictable, especially after a severe correction like the last one we saw on the chart. The unexpected drop from $70,000 clearly became a reason for speculation about the future of this rally and the potential the digital gold can show in 2024. Recently, top-tier analysts at Bernstein set the target price level for Bitcoin at $90,000 by the end of the year.
 Dan Burgin
 U.Today Editorial Team