Disclaimer: The opinions expressed by our writers are their own and do not represent the views of U.Today. The financial and market information provided on U.Today is intended for informational purposes only. U.Today is not liable for any financial losses incurred while trading cryptocurrencies. Conduct your own research by contacting financial experts before making any investment decisions. We believe that all content is accurate as of the date of publication, but certain offers mentioned may no longer be available.
Renowned trader Peter Brandt recently shared a chart that appears to provide crucial hints regarding potential future fluctuations in the price of Bitcoin. Because it offers valuable insights into possible future prices, Brandt claims that this chart is essential for understanding Bitcoin's binary price possibilities.
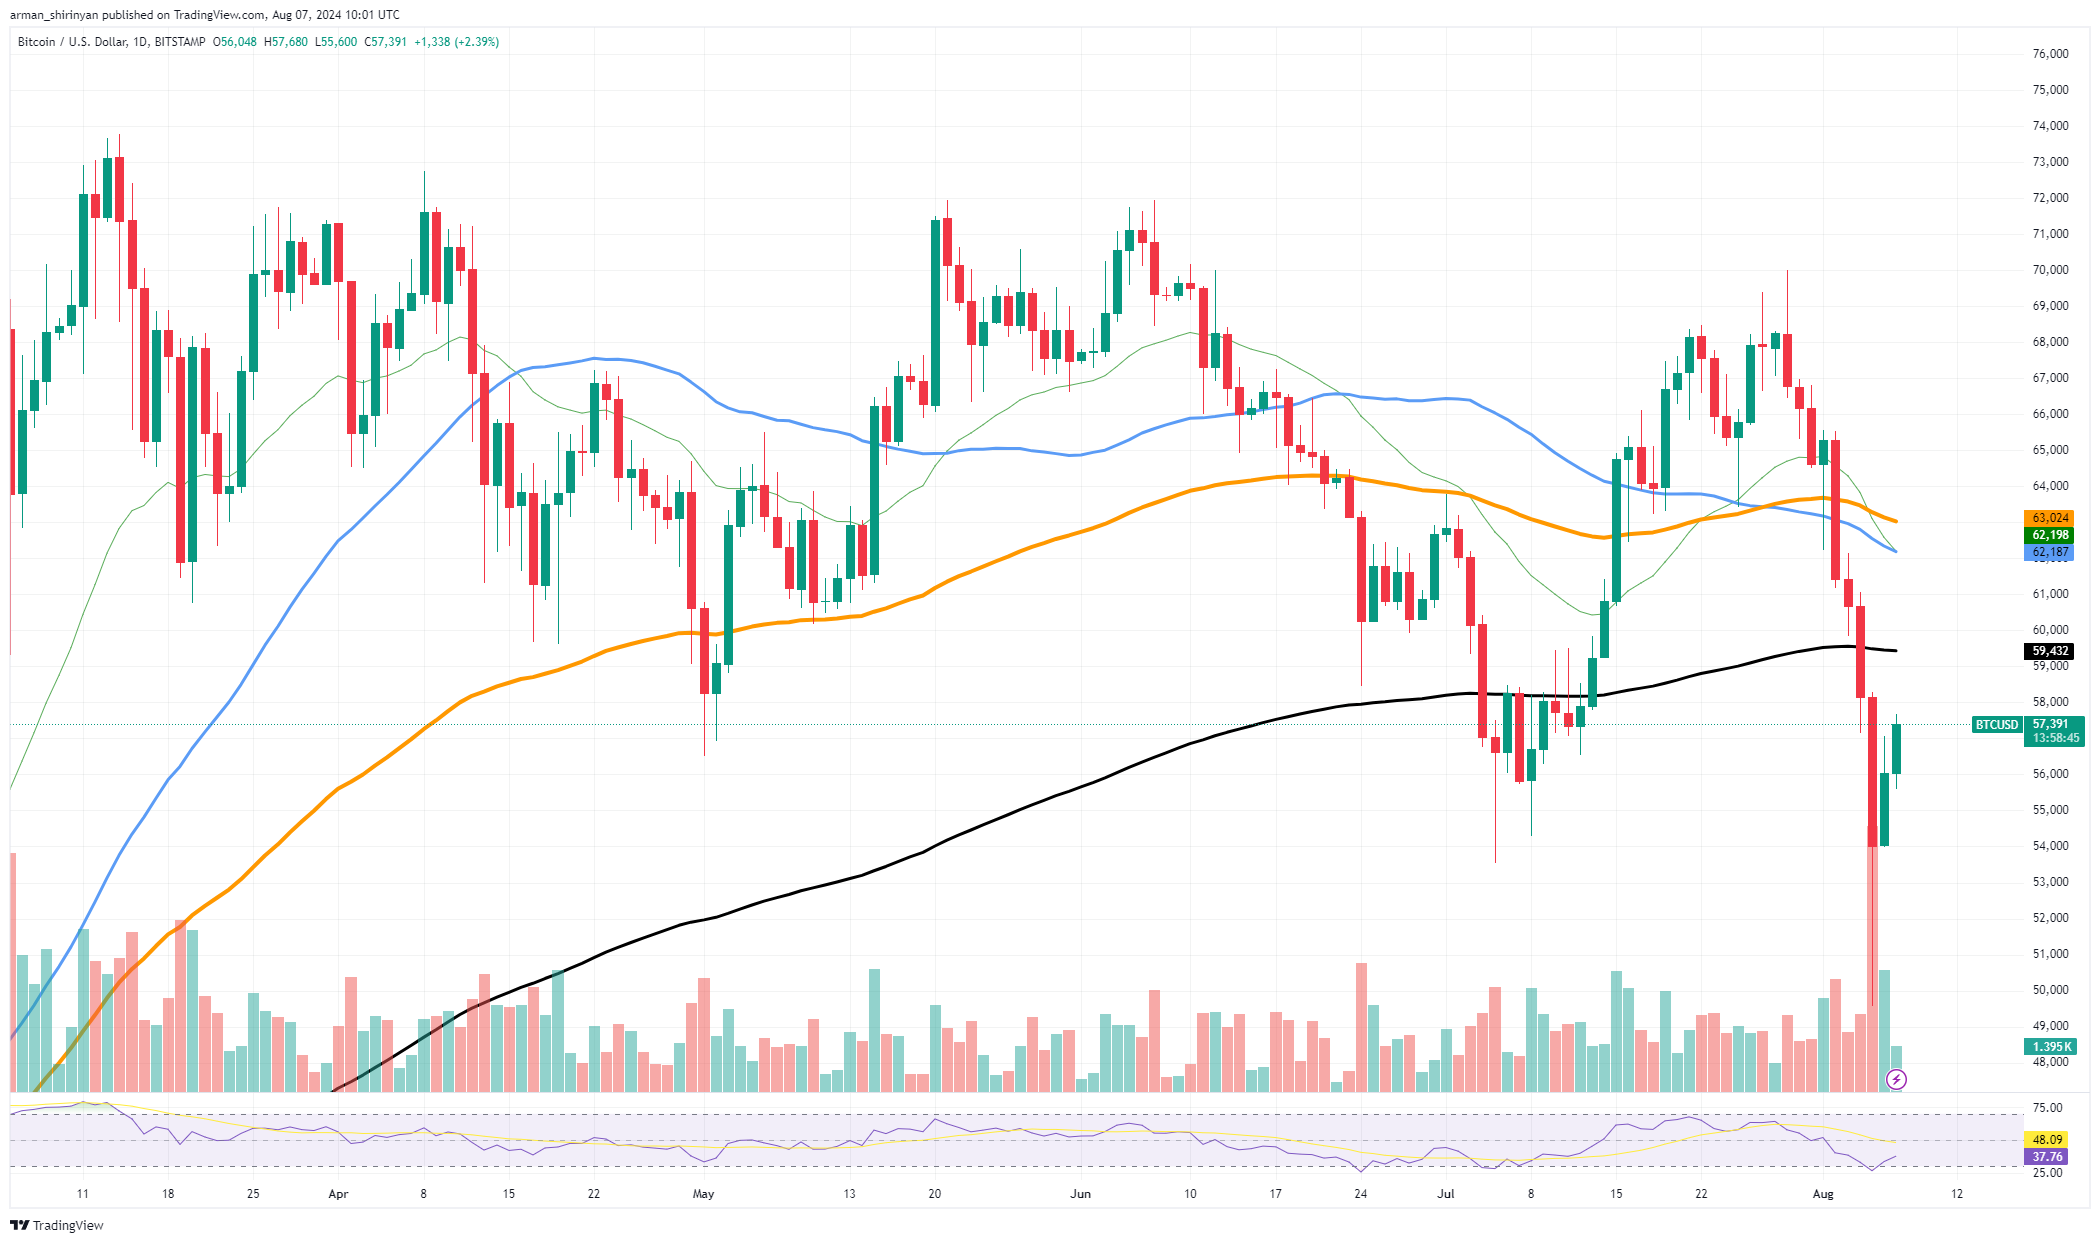
The chart that HTL-NL first released suggests that Bitcoin may have already peaked. This conclusion is reached by combining the relative strength index (RSI) with multiple technical indicators. The chart shows that the RSI continuously falls at every new high, indicating that the buying momentum has been declining over time.

The potential for Bitcoin's short-term growth may be limited as a result of this price action's declining elasticity. It is further supported by the chart, which shows the occurrence of a larger cycle top that the price of Bitcoin may face significant resistance in the future.
According to this pattern, the cryptocurrency's bullish momentum has mostly run out, leaving it more vulnerable to downside pressure. Brandt has shared the chart to highlight the importance of "binary price possibilities."
Anyone trying to grasp the possible binary outcomes for the price of Bitcoin, in his opinion, needs to understand these patterns. Basically, the chart suggests that Bitcoin has topped-out and the current cycle is exhausted. It dramatically raises the possibility of a reversal or a prolonged correction.
This outlook is also reflected in the state of the Bitcoin market right now. The price of BTC continues to fluctuate significantly in both directions as the market has not settled yet. A number of macroeconomic variables and regulatory changes are having a major impact on the market. Institutional investors remain key players nowadays and, luckily, we are seeing a recovery of institutional inflows in the market, suggesting a potential continuation of an uptrend.

 Dan Burgin
 U.Today Editorial Team