
Failing to break resistance again and again, IOTA disappoints traders, but they don’t lose hope. What to expect from it in the nearest time? Will IOTA test $0.5 resistance again, and how successful will those attempts be? Let’s see what TradingView users think about this unique altcoin: read IOTA price forecasts and check the price charts.
IOTA depends on Bitcoin
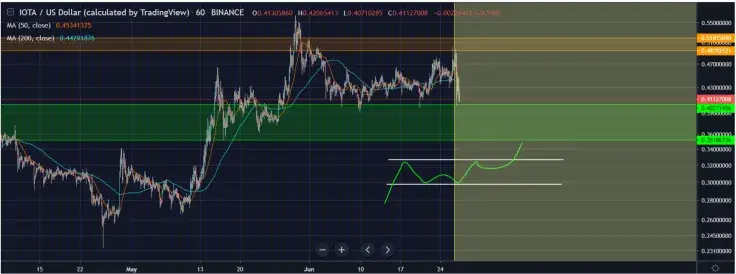
IOTA is testing its resistance zone again and again, and on June 27, it bounced again. Resistance was denied, but the lower support zone held nicely. All we can do now is simply watch for successful retrace and wait. VOC-Handelaar claims that IOTA is dependent on BTC's next move, so, probably, Bitcoin’s failures can contribute to the thriving of alts, including this one.
Your chance to buy IOTA
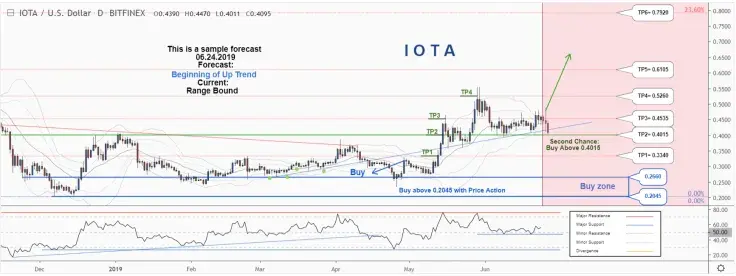
Here’s a pretty realistic midterm forecast from ForecastCity. They claim that 0.4015 is major support, while this level is not broken, the midterm wave will be uptrend. Luckily, IOTA still holds above this level.
What about technical indicators? According to the technical analysis, IOTA price is above WEMA21, if the price drops more, this line can act as dynamic support against more losses.
Relative strength index (RSI) is 55.
So, what their trading suggestions will be?
-
There is still a possibility of temporary retracement to the suggested support line (0.4015). If so, traders can set orders based on Price Action and expect to reach short-term targets.
-
If you missed our first chance to make a profit, you have a second chance to buy above the suggested support line (0.4015).
What about the entry signal? Signal to enter the market occurs when the price comes to "Support line" then forms one of the reversal patterns, whether "Bullish Engulfing", "Hammer" or "Valley", in other words, no entry signal when the price comes to the zone BUT after any of reversal patterns is formed in the zone.
If IOTA manages to break $0.5 resistance, that would be the beginning of a new uptrend. In this case, ForecastCity recommends to take profits on the following targets:
TP5= @ 0.6105
TP6= @ 0.7920
TP7= @ 0.9265
TP8= @ 1.1550
TP9= @ 1.4475
And so on...the price of IOTA can even reach $4 in the mid term, judging by this analysis.
IOTA is bottoming out
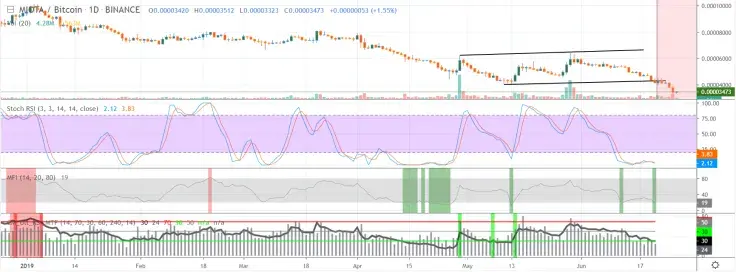
According to GlobalTrader_, IOTA Looks to have bottomed out. Currently, its price has slowly started emerging from the bottom of the channel. Besides, Stochastic RSI, RSI & MFI was oversold on the daily chart. If you look at the weekly IOTA price chart, looks possible for a 50% drop. Sounds pessimistic, but it might be a perfect time for entering the market.
H&S pattern didn’t play out
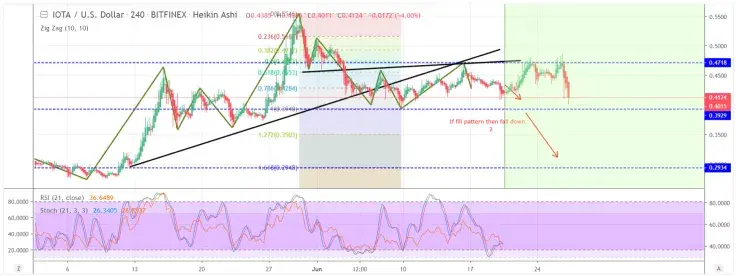
Recently, IOTA has been testing a great Head & shoulders pattern. Seems like it hasn’t validated. That’s why the threat still exists. User khosrooparviz claims that if IOTA breaks $0.3929, we should expect a fall down to $0.3503 so 2nd tp can be $0.2948 based on Fibonacci.
Final thoughts
Not the best times for IOTA: it is struggling with a new resistance zone after failing to hold the oldest support line for the second time this year.
What does the future hold? Demand at 4k sats seems good, but every time it hits 4k or below, a violent buyback happens. IOTA seems to be staying between resistance and demand for a while.
Technicals also don’t allow for making 100% accurate predictions, but it seems like IOTA is having a double bottom. That can be seen on weekly and shorter time frames.
So will it hit the $0.5 target in the nearest terms? Not likely. Wait for a few days and enter the market, or keep your IOTA in the wallet and simply wait.
IOTA price charts by TradingView
 U.Today Editorial Team
 Dan Burgin