
Disclaimer: The opinions expressed by our writers are their own and do not represent the views of U.Today. The financial and market information provided on U.Today is intended for informational purposes only. U.Today is not liable for any financial losses incurred while trading cryptocurrencies. Conduct your own research by contacting financial experts before making any investment decisions. We believe that all content is accurate as of the date of publication, but certain offers mentioned may no longer be available.
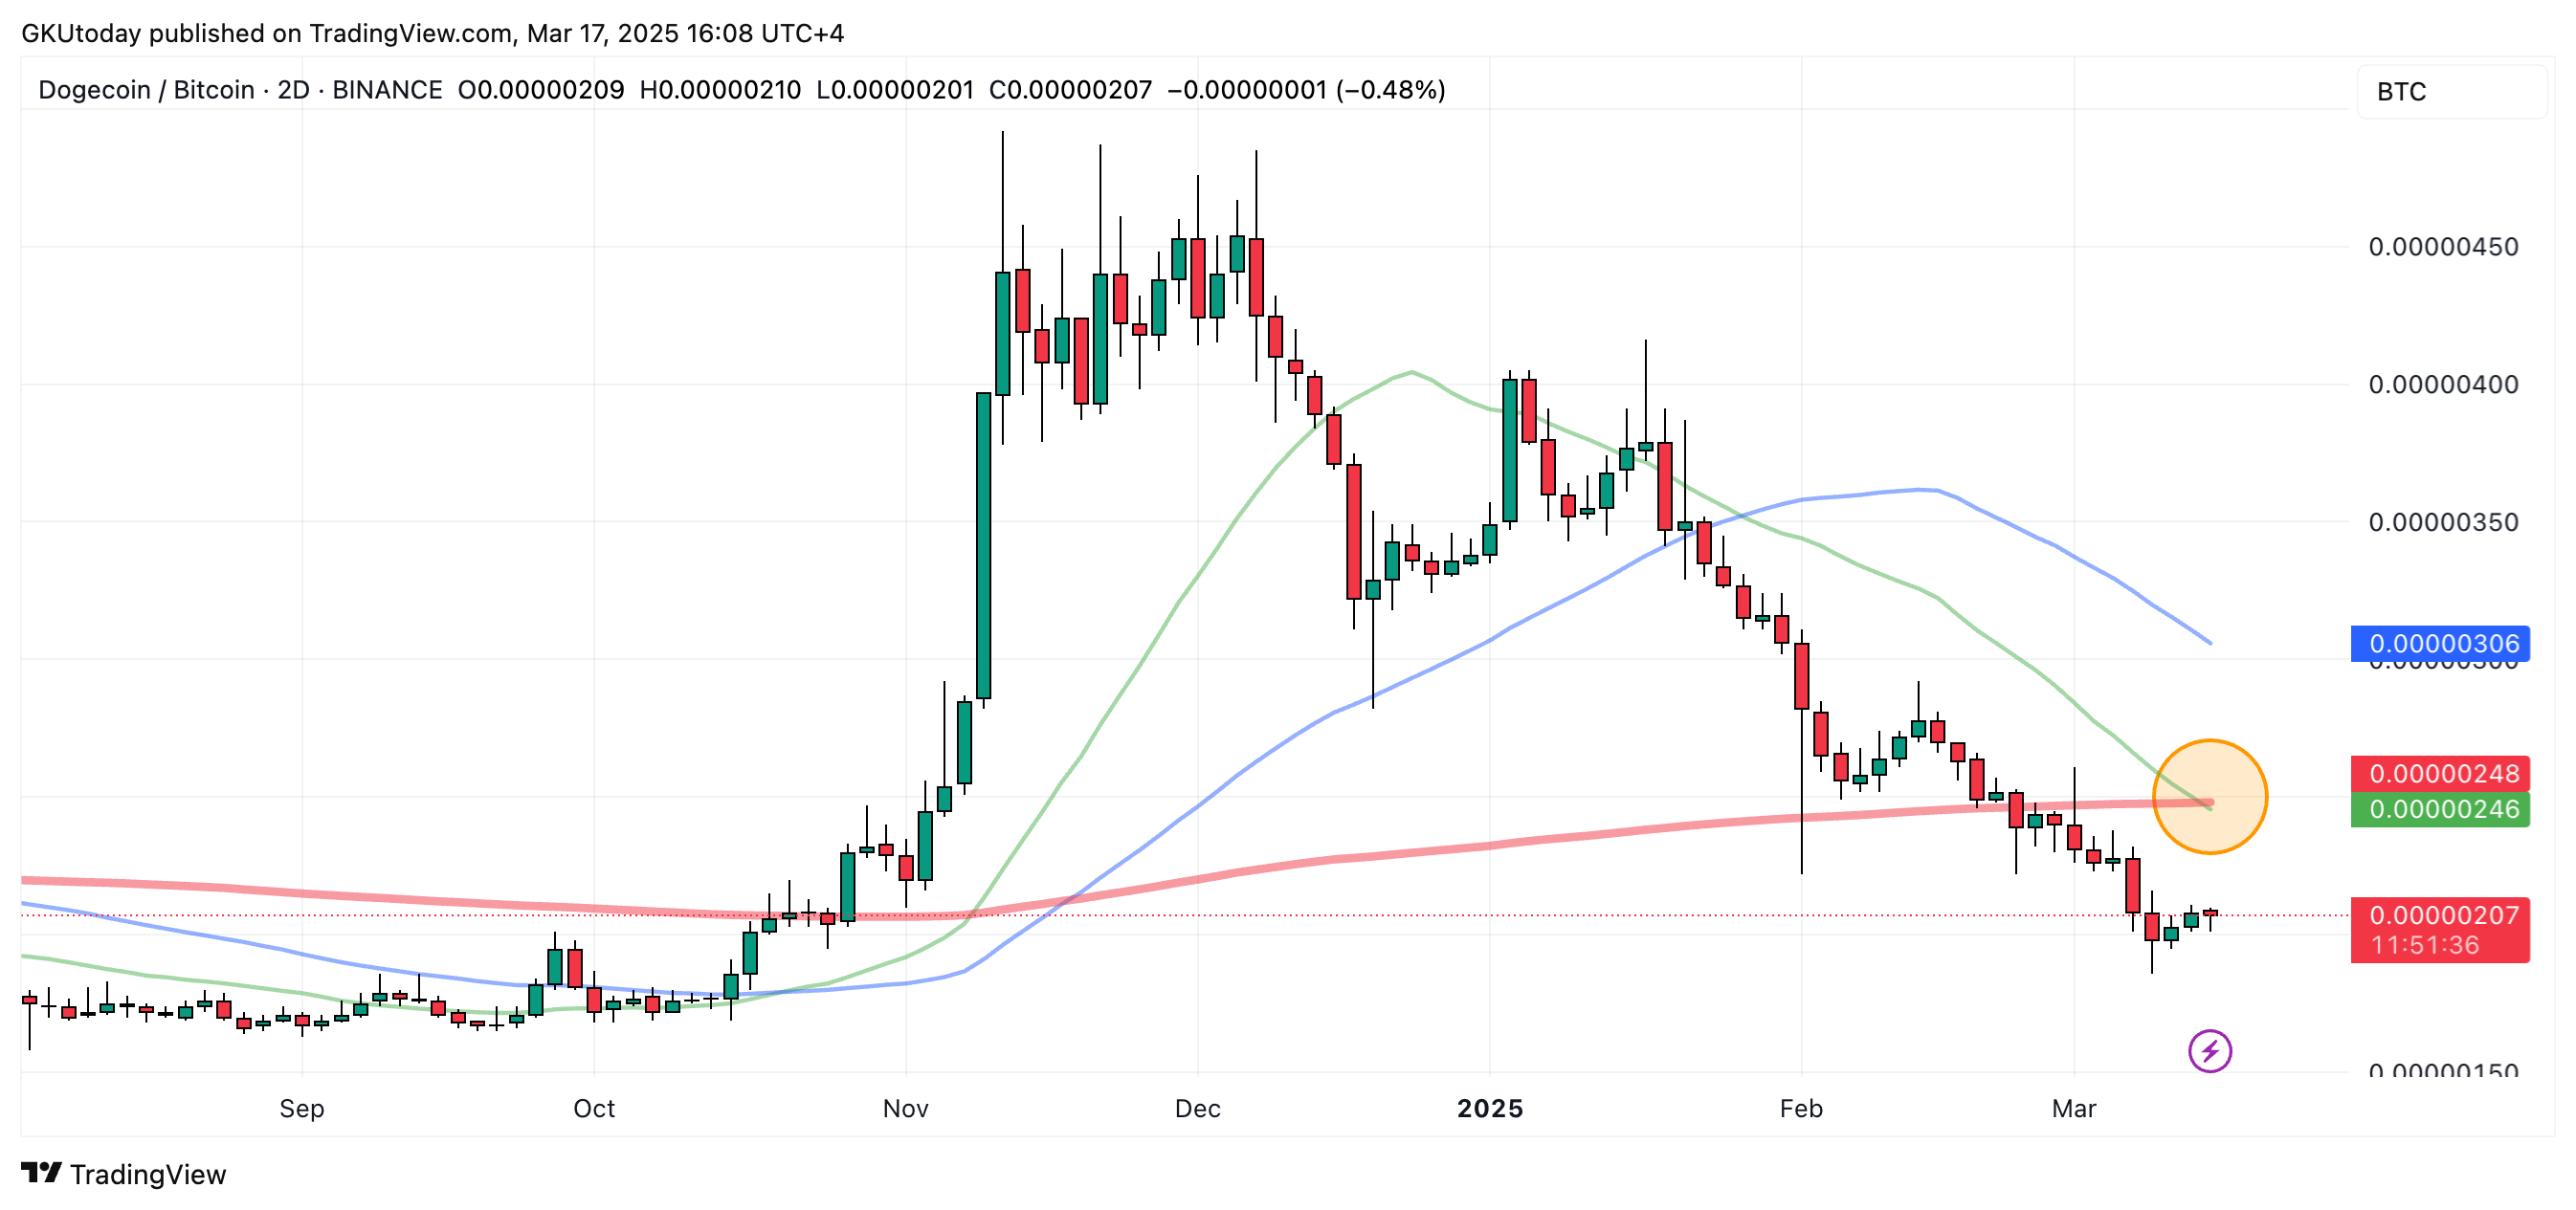
Ominous pattern recently emerged on the price chart of the most popular meme cryptocurrency in the world, Dogecoin (DOGE). The talk is about the 23-day moving average crossing from an upside down to a 200-day moving average, which forms a figure of technical analysis better known as death cross.
This is a pairing of Dogecoin to Bitcoin (BTC), by the way. The catch, however, and there is one, is that it happens on the two-day time frame of DOGE, which is not a common price chart setting many pay attention to.

That said, in times when trading is more and more managed by algorithms, and bots and artificial intelligence are being implemented further into financial markets, particularly in cryptocurrencies, something seemingly exotic - even if it is just a slight tweak, like stretching the time frame to a two-day scale - may provide an angle few have considered.
For Dogecoin, that angle happens to reveal a death cross for the meme coin versus BTC.
What is death cross?
If history and technical analysis have anything to say about it, the emergence of a death cross often signals a correction for the asset in question.
Given that DOGE has already been grinding lower, particularly after the brief euphoric bump surrounding the U.S. elections that quickly morphed into a kind of post-hype hangover, this fresh development could be the market's way of saying that Dogecoin will continue to lag behind Bitcoin.

If the market trends upward, DOGE might struggle to keep pace. If the market corrects downward, it could see even more painful dips relative to BTC.
While these technical signals are rarely set in stone, especially when they are not on the usual chart settings, they provide an interesting, if not cautionary, note to traders.
 Dan Burgin
 U.Today Editorial Team