
Disclaimer: The opinions expressed by our writers are their own and do not represent the views of U.Today. The financial and market information provided on U.Today is intended for informational purposes only. U.Today is not liable for any financial losses incurred while trading cryptocurrencies. Conduct your own research by contacting financial experts before making any investment decisions. We believe that all content is accurate as of the date of publication, but certain offers mentioned may no longer be available.
Dogecoin has entered a downtrend, as it has recently fallen below the pivotal 50 EMA. This barrier is important for DOGE because it usually denotes bullish momentum when it is maintained above. However, a decline below it signals a shift into bearish territory and raises questions about the asset's short-term outlook. The price action of late has brought DOGE's vulnerability to light.
The failure of Dogecoin to maintain above the 50 EMA is concerning despite the general weakness of altcoins. It implies that selling pressure is outweighing buying interest, which could result in a decline that goes even lower if the current trend keeps up.
In technical terms, a death cross happens when a long-term moving average crosses below a short-term moving average. DOGE's decline below the 50 EMA is a precursor that frequently indicates more negative developments, even though it has not yet formed a full death cross.
Bitcoin's weakness
The market dominance of Bitcoin is progressively waning as it exhibits signs of decline. Indicating a sharp decline in market strength, the price of Bitcoin has recently fallen to the 100 EMA. This action raises the possibility that the bullish momentum for Bitcoin is waning. The high level of liquidity around $63,000 is highlighted by the most recent market data, which is crucial.
The EMAs also converge at $63,000, which strengthens this price as a possible support zone, making this area more and more significant. It is possible that Bitcoin will test this level soon if it keeps going downhill. The decreasing volume is another alarming indicator. A drop in trading volume is frequently a sign that the trend is becoming less popular. The lower volume, in the case of Bitcoin, raises the possibility that the recent uptrend may not be long-lasting.

This could result in further declines if the selling pressure picks up, so traders and investors should exercise caution. The current status of Bitcoin is clearly depicted by the technical indicators. An indication of waning support for the price of Bitcoin is the alignment of the 50, 100 and 200 EMAs.
If Bitcoin drops below the 100 EMA, a recent support level, it may turn into a crucial resistance level. The $63,000 mark has historically been important for Bitcoin, acting as both resistance and support at different points in time.
Tron's unexpected decline
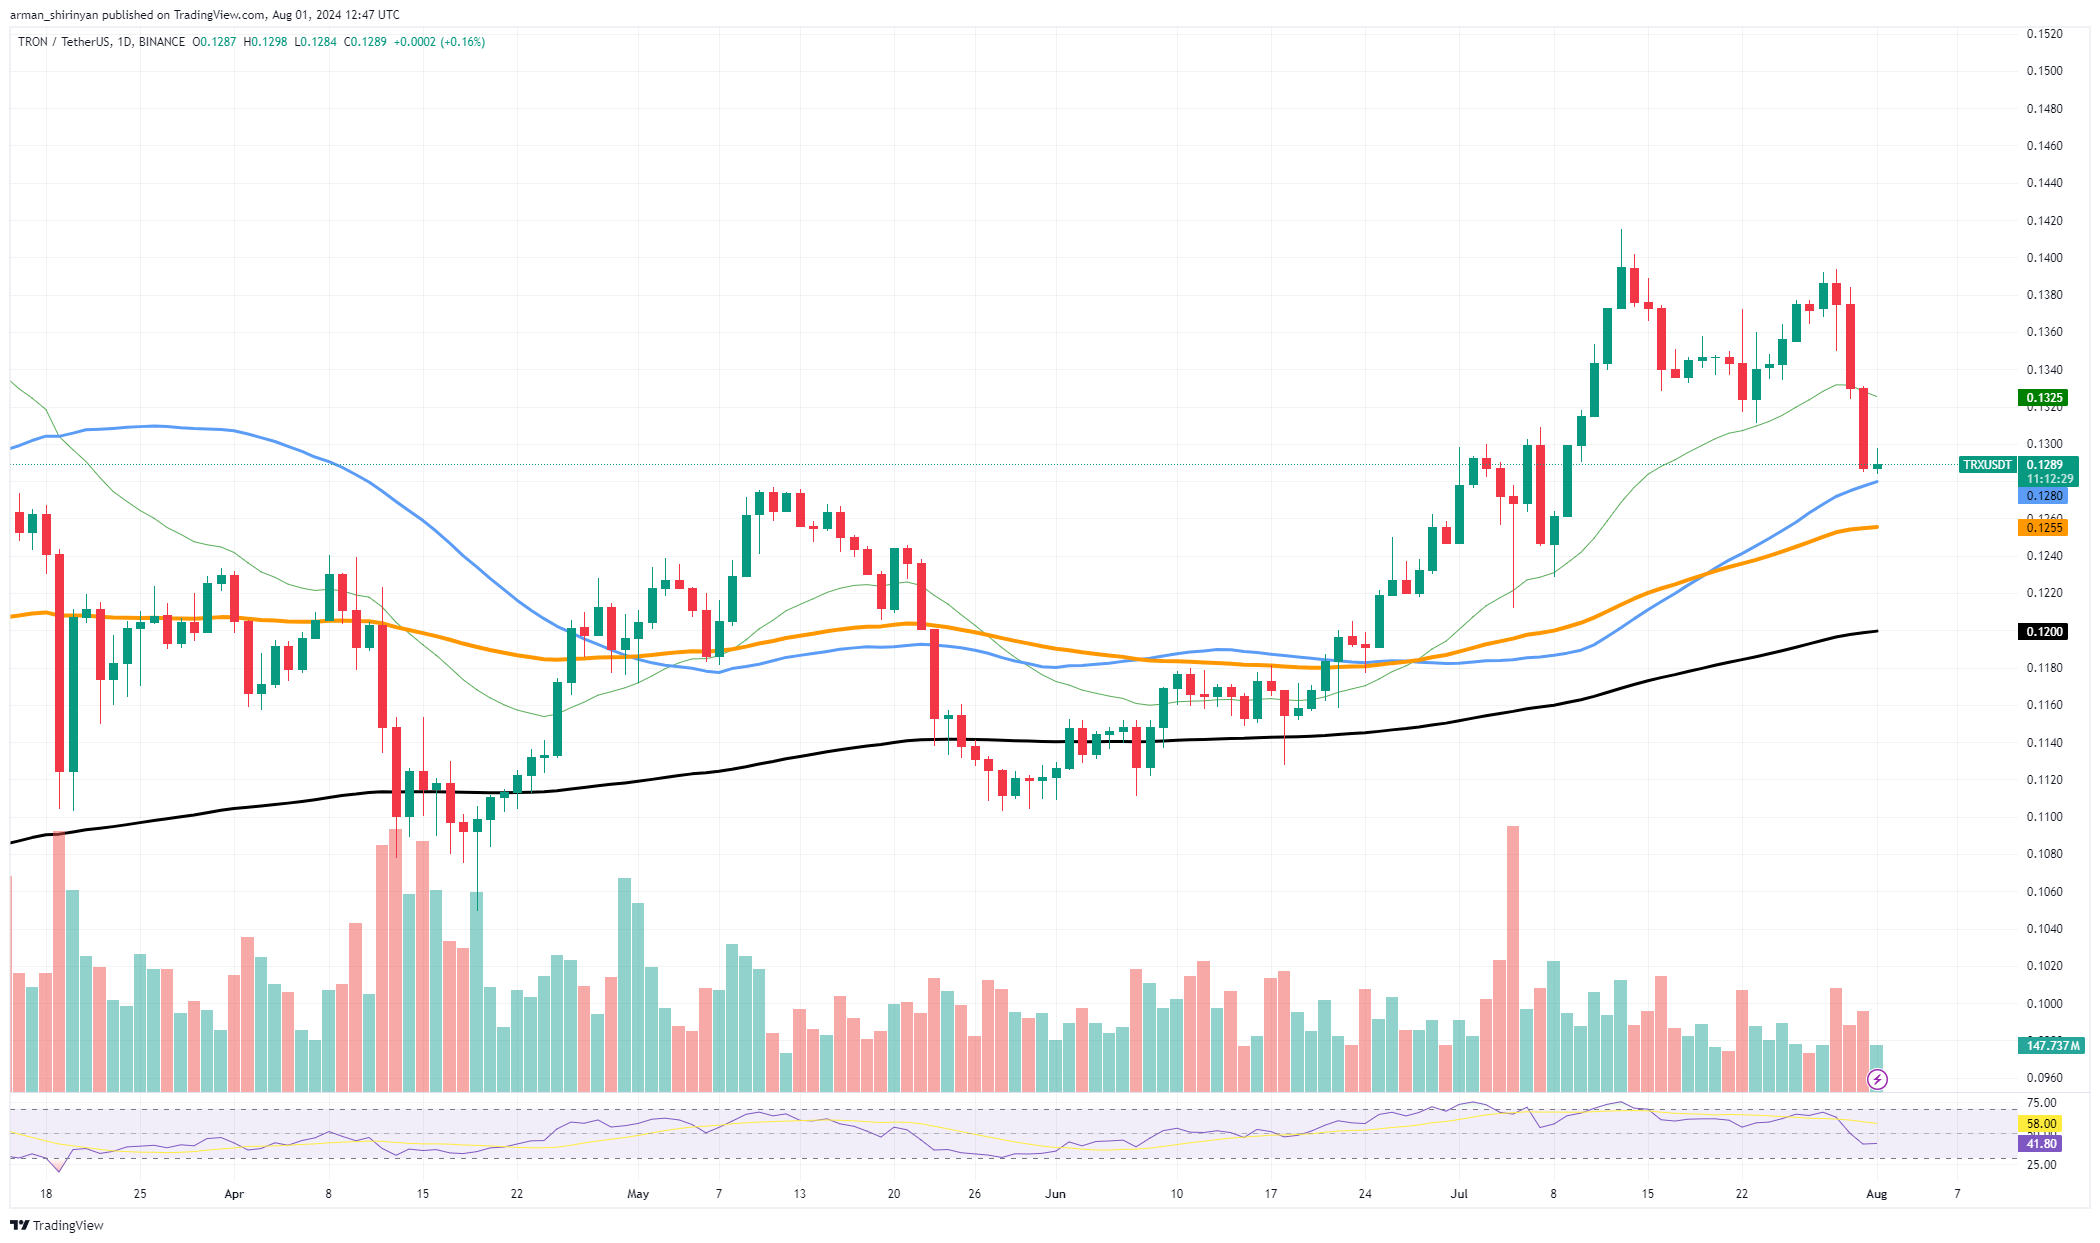
Recently, there was a huge decline on Tron of 6.4%. TRX has fallen to the 50 EMA, a critical support level, as a result of this sharp decline. Investors may have some hope that TRX will rebound from its sharp decline because this support level is frequently regarded as a possible point for a price reversal.
There are nevertheless additional variables to take into account. The fact that the RSI has fallen below 50 is a bearish indication that there is significant selling pressure. This phenomenon implies that unless there is a substantial change in market sentiment, the current downtrend may continue.

TRX could still drop even more, though it has found support at the 50 EMA. In the event that the price breaches this level of support, $0.1200 would be the next significant support. A decline below it could indicate longer-term bearish activity. Historically, this level has offered a solid base.
These support levels are something that investors should closely monitor. Important levels to keep an eye on are the 50 EMA, which TRX is presently holding, and the $0.1200 level below it. A 50 EMA bounce might suggest a reversal and possible recovery. The $0.1200 support level could be tested if the market is unable to hold above this level.
 Dan Burgin
 U.Today Editorial Team