
Disclaimer: The opinions expressed by our writers are their own and do not represent the views of U.Today. The financial and market information provided on U.Today is intended for informational purposes only. U.Today is not liable for any financial losses incurred while trading cryptocurrencies. Conduct your own research by contacting financial experts before making any investment decisions. We believe that all content is accurate as of the date of publication, but certain offers mentioned may no longer be available.
Stellar Lumens is staying on the current level without showing signs of improvement, but traders say that changes are slowly coming. What does it mean? Will XLM overcome the resistance areas and enter the bullish area before 2020 starts? Let’s check the technical analysis and read XLM price predictions from TradingView users.
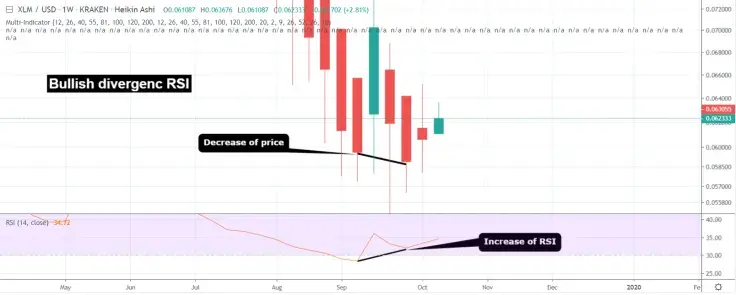
If we look at this weekly chart we will see that there’s a bullish divergence on the RSI. It means that the price is decreasing while the RSI is increasing. That's a pretty big bullish signal. It’s very likely that the bulls are taking positions for a new bull run.
But when the breakout should happen? Seems like it won’ happen earlier than in a few weeks, and other XLM price predictions prove that.
The trend will reverse in Q4 2019
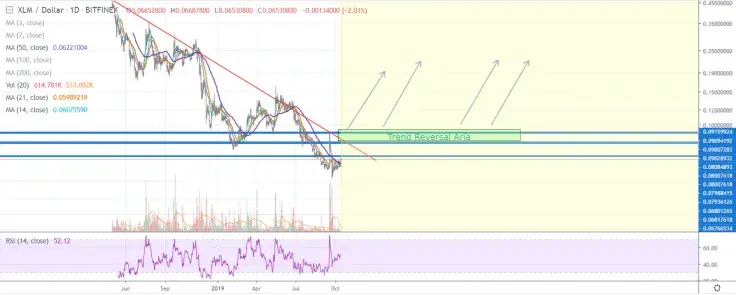
As we can see on the price chart from UTS_Trader, XLM should reach the reversal area for the current price to change. It’s located in the $0.09 price zone and higher. Thus, XLM price won’t grow sufficiently until the 9-10 cent area is reached.
Some traders say that RSI means nothing now. The breakdown point RSI was oversold and traders thought it can pump easy now and didn’t want to buy cause RSI was overbought.
The price spike at everyone is waiting for would bring XLM to 3000 satoshi resistance area. We shuld also watch for the BTC run coming with XLM together (which won’ happen earlier than the next week).
We are doing falling wedge on 4 hr chart, so if the chart is same falling wedge completes around October 15th at 0.056 and pump comes, it looks like on that chart also it went previous week low 0.056 will be the previous week low. RSI can spike on weekly chart now it is ready to go.
 Dan Burgin
 U.Today Editorial Team