
May 21 has started with a slight correction on the crypto market; all top coins are in the red zone. The biggest loser is Cardano, whose rate has dropped by more than 3% overnight.
The United States Securities and Exchange Commission’s approval for VanEck’s Bitcoin ETFs was again postponed, which served as the main cause of the decline.
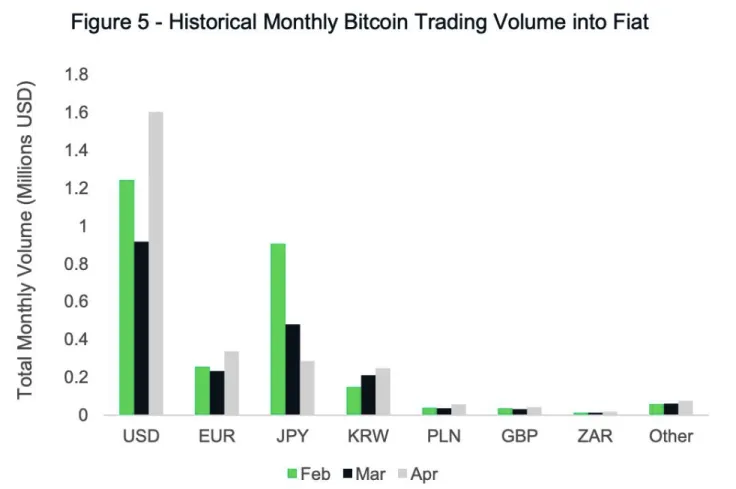
However, the popularity of cryptocurrency keeps increasing, which is confirmed by the growing trading volume on centralized exchanges. The increasing volume has grown by 85% on the leading platforms trading fiat against cryptocurrencies.
BTC/USD
The rate of the main digital asset has slightly decreased over the last 24 hours. As we have mentioned above, the possible reason for it is the refusal of Bitcoin ETFs.
The coin has been trading sideways for the last few days, which might mean the possibility of the close correction, taking into account the historical snapshots.
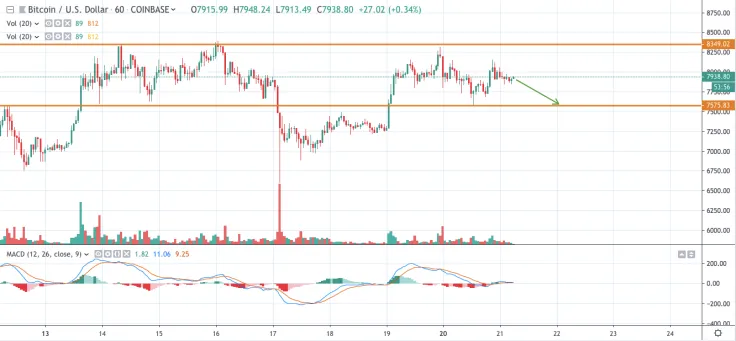
On the hourly chart, Bitcoin is located between the support zone at $7,500 and resistance one at $8,300. The trading volume has declined sharply over the last days, which is backed by the decrease in BTC’s domination rate.
In this regard, the nearest scenario is touching the $7,575 mark.
The price of BTC is trading at $7,942 at the time of writing.
ETH/USD
Ethereum is almost copying BTC’s pattern, as its trading volume has also significantly declined over the last 24 hours. Although there was no negative news regarding Ethereum, the current rollback was just an action following the example of the leading crypto.
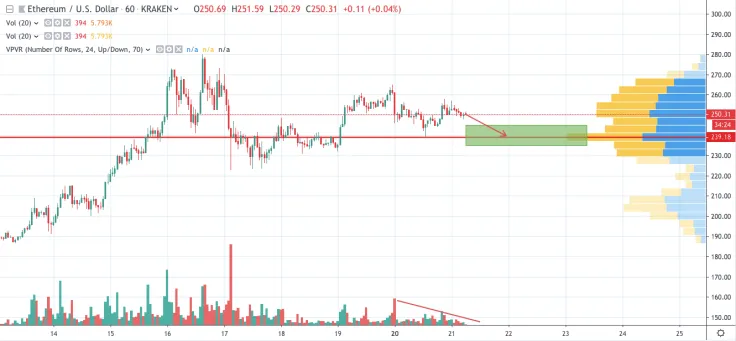
Analyzing Ethereum on the hourly chart, one can see that nothing shows the potential uptrend. Currently, the coin is struggling to remain at the psychological level of $250. However, there is a high probability of going down to the green corridor of $235-$245.

The price of ETH is trading at $250.31 at the time of writing.
XRP/USD
Unfortunately, our XRP price prediction was not justified, as the expected breakthrough of $0.4100 did not happen. Currently, it is the biggest loser among the top 3 coins, as its rate has declined by around 2% over the last day.
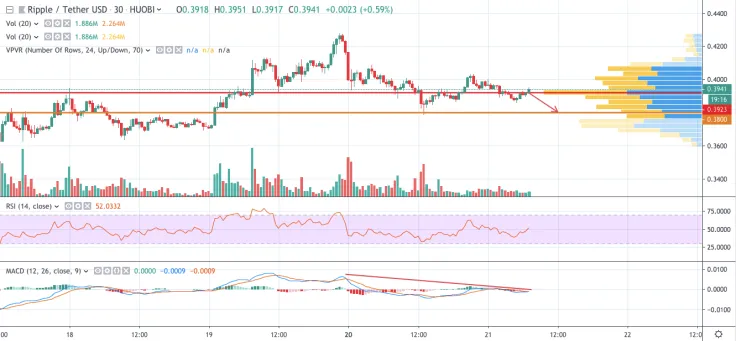
On the 30 minute chart, the situation does not look promising, as XRP has been trading sideways for 3 days already. Moreover, the MACD indicator shows bearish tendencies and can push the rate down to $0.38.
The price of XRP is trading at $0.3920 at the time of writing.
 Dan Burgin