Breaking resistance again and again, Bitcoin continues making its way to the top and has recently spiked to $8,300 before retracement. The bull market seems to have ceased from now on, and traders guess how low BTC might go. Some are sure there’s still hope for Bitcoin to make few leaps. Will it reach the previous $20,000 mark or at least crawl to $10K mark? Let’s check out Bitcoin price forecasts from TradingView users: they come up with different interesting scenarios.
BTC aims for $10K on Elliot waves

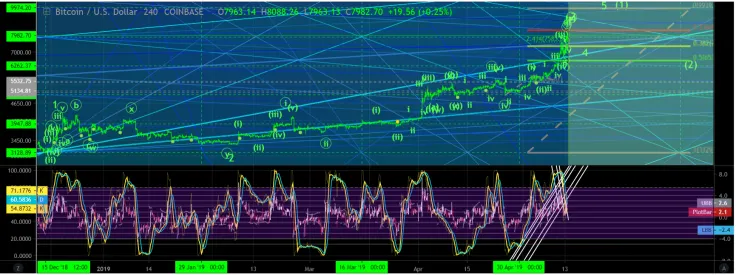
Looking at the BTC price chart from Mikelikescrypto, we can see the frequency of Elliot waves pattern and Bitcoin’s recent performance. According to the trader, after the previous Elliot wave count, Bitcoin’s next possible target is $8,600, and then it would be possible to hit $10,000.
Consolidation is coming?

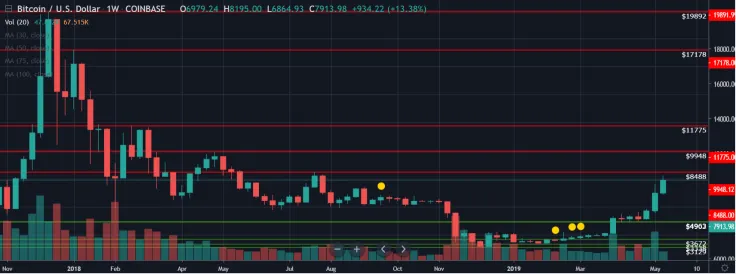
My2Sats analyzed the previous resistance and support levels for BTC. Last time, we were searching for a higher low compared to $3,338 to then try and shift momentum and get a higher high above $4,188. Clearly, BTC did that and really anyone buying in on the weekly chart shift from its bearish lower highs and lower lows to the bullish pattern of higher lows and higher highs once we broke above $4,188 has been extremely happy.
It’s been almost a straight bull run since then. The weekly chart is pushing above some major MA's. RSI is overbought for the first time since the end of 2017! The past few weeks have been so bullish, we have not established much in terms of support on the way up. Some consolidation would be logical, a higher low and then moving up, but anyone who has been in this market knows the bulls can start running more parabolic if FOMO sets in.
As for the trading strategy, we can just ride stop losses based on higher lows for these rather than trying to actively trade anything while gone. Hopefully, bulls will continue the momentum after the pause and keep things pushing upwards but on the technical side, we really could use some consolidation and forming some bases of support.
Look at the crazy Bitcoin fractal

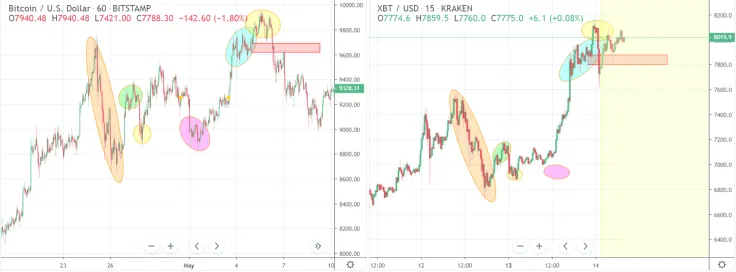
For botje11, the current BTC performance is reminiscent of a 10K rally that has already happened. Back then things went much faster than the past half year. But now when thinking about it again, this rally has been extremely fast, so in that sense, it's actually even good. The fractals on the BTC price charts are here to show how the market evolves.
Botje11 believes that if we stay below $7,900/$7,850, reaching $10K might still be real. If it breaks, let’s forget about it for some time. This is bouncing up quite strong now. Bears attempted to drop BTC, but the sell volume isn’t strong enough.
Time will show who has the power to short the market now. At the moment, selling volume is not enough. The fractal is not completely over yet, but becoming more likely to be a failure. $7,800 is the main support level, so we should see whether Bitcoin can keep it.
$8,250 is the next serious resistance

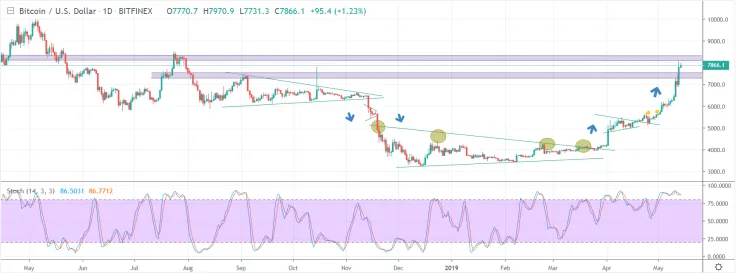
Patient longs have been rewarded as Bitcoin has gone parabolic, in a rally of remarkable proportions, even for this cryptocurrency. BTC/USD has surged beyond resistance at ~$7,250, and gone on to break $8,000, touching a new yearly high of $8,169.
Its surge has also boosted most of the major cryptocurrencies and added ~$30b to the overall cryptocurrency market capitalization. This has been a move supported by volume and the ‘whales’ of the industry; tracking data showed the rally supported by trading from large Bitcoin holders, with the single biggest whale moving some 47,000 BTC into the market. Our next meaningful resistance is in the $8,250 region –if BTC gathers $1,000 in price again it would mean a new victory and a new bull wave.
Price charts are taken from TradingView


 Caroline Amosun
 Tomiwabold Olajide