
After hitting the $8,000 threshold, Bitcoin has stopped for a while, so traders are wondering whether the higher high of $9K will happen. In case you’re hesitating and don’t rush to sell your BTC reserves, read Bitcoin price predictions from TradingView experts: they have come up with a few reasonable suggestions for BTC’s future.
The last pump to $10K is still coming
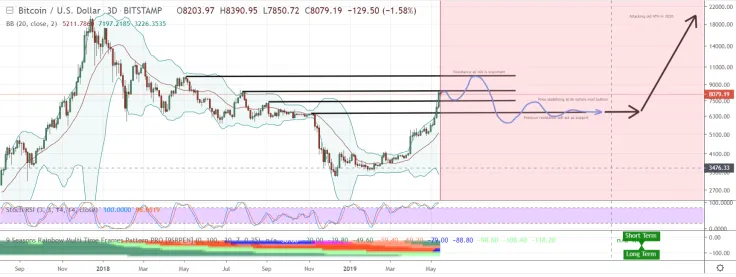
According to FlaviusTodorius67, every time BTC makes a pause, traders come out and draw the arrows pointing down, to at least $6,000 now from $8,500. However, the dump at $8,500 wasn't strong enough. The reaction was weak as if the resistance wasn't even that important.
The same happened at the mighty $7,500 resistance area, which turned out not to be so mighty after all. The previous $6,500 level wasn't even resistance for BTC. As BTC is preparing one last push, this would also fight the weekly picture.
BTC will go to $10,000, then dump to $5-6,000, and stay oscillating around $6,000 until it stabilizes and prepares for the next bull run in early 2020, but this time, targeting the old ATH. Which of course it will break at some point in 2020, making new highs.

Bitcoin parabola tells the future
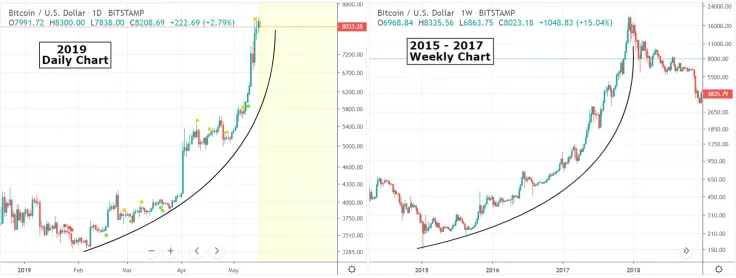
Traders have discussed Bitcoin's recent hyper-aggressive rise a lot, and there’s no doubt that it is a strong confirmation that the new Bull Market has started. Backed by strong fundamentals, this time can be different, more aggressive and unpredictable. TradingShot has analyzed BTC's parabolic behavior. This is one of the most common patterns throughout Bitcoin's history, more specifically during its bull cycles.
It is interesting however to keep in mind how such parabolic movements typically end up. Compare BTC's current (2019) mini parabola on 1D (daily chart) with the parabolic rise during the previous bull cycle (2015-2017) on 1W (weekly chart).
The comparison here highlights the results of a potential break of the pattern. That also shows how emotional trading works.
So, let’s see how parabolas have worked during a Bull Cycle and in particular the last one (2015-2017):
We clearly see that when Bitcoin broke a parabolic rise most of the times it hit the 0.618 Fibonacci retracement level. Twice it hit (or almost) the 0.786 level while once the 0.5 level. It is apparent how Bitcoin behaves in parabolas but of course, each time can be different in its own way. Especially when heavy fundamentals (i.e. wider acceptance etc) are involved as the current period we trade on.
When this pattern validates, BTC will retrace back to its support area somewhere around $4,000.

Bulls are still holding
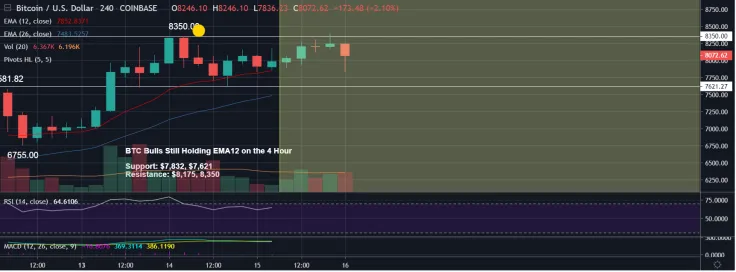
BTC bulls are still holding very strong day after day. Traders are surprised that we’ve managed to get to $8,000 and how long we have held it.
The sideways tight action for BTC last night allowed for ETH bulls to break out to higher highs. ETH/BTC was at key weekly support and fueled the move higher. LTC/USD bulls also showed up, but still lagging behind with the inability to break the recent highs just under $100.
Keeping an eye on LTC this morning to see if it will be a laggard play, but also cautious because a loss of the 4-hour uptrend and EMA12 support would indicate BTC needs to see daily consolidation. Our resistance is $8,175 now.
Price charts are taken from TradingView
 Dan Burgin
 U.Today Editorial Team