
Disclaimer: The opinions expressed by our writers are their own and do not represent the views of U.Today. The financial and market information provided on U.Today is intended for informational purposes only. U.Today is not liable for any financial losses incurred while trading cryptocurrencies. Conduct your own research by contacting financial experts before making any investment decisions. We believe that all content is accurate as of the date of publication, but certain offers mentioned may no longer be available.
After a slight consolidation phase on the weekend, the cryptocurrency market has continued the bullish cycle. All Top 10 coins are again in the green zone while the top gainer is Litecoin (LTC), whose rate has rocketed by 7.91%.
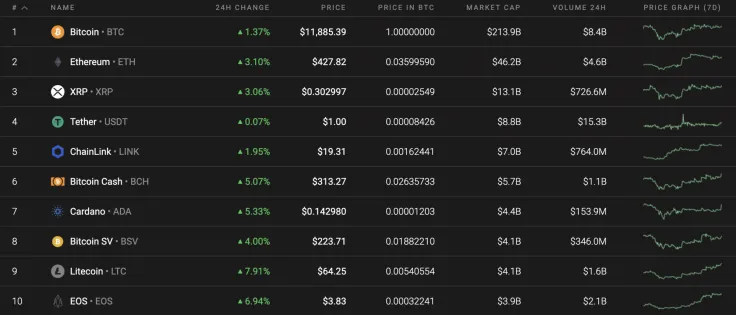
The main statistics today for Bitcoin (BTC), Ethereum (ETH), XRP, Chainlink (LINK), Bitcoin Cash (BCH) and Litecoin (LTC):
|
Name |
Ticker Advertisement
|
Market Cap |
Price |
Volume (24h) Advertisement
|
Change (24h) |
|
Bitcoin |
BTC |
$219,141,363,028 | $11,869.04 | $20,532,716,501 | 1.52% |
|
Ethereum |
Ethereum |
$47,912,353,614 | $426.97 | $12,101,595,303 | 3.49% |
|
XRP |
XRP |
$13,616,274,565 | $0.303131 | $2,120,608,149 | 3.60% |
|
Chainlink |
LINK |
$6,710,058,736 | $19.17 | $1,467,966,368 | 2.09% |
|
Bitcoin Cash |
BCH |
$5,829,328,644 | $315.23 | $2,074,343,748 | 4.63% |
|
Litecoin |
LTC |
$4,205,733,440 | $64.45 | $3,619,051,261 | 7.16% |
BTC/USD
Over the weekend, trading was calm. The Bitcoin (BTC) price is in a narrow sideways range, just above the average price level. Sellers managed to pierce the 2-hour EMA55 several times, but the POC line ($11,754) acted as additional support.
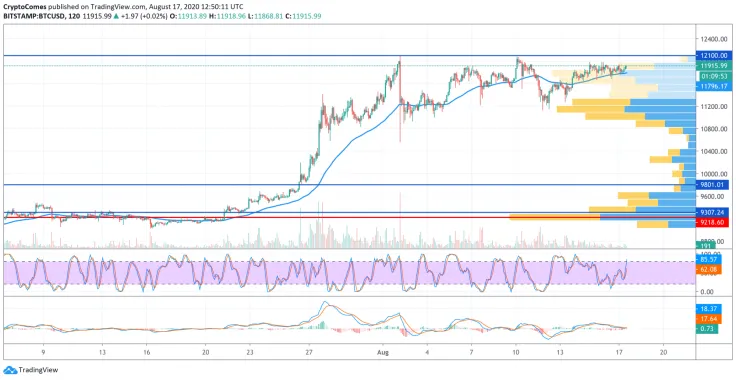
As of this morning, trading volumes have dropped dramatically and buyers have not been able to approach the resistance of $12,000. On the daily time frame, the Stoch RSI indicator lines have left the oversold zone, signaling a possible rise in the pair.
However, growth has not yet been confirmed by the MACD indicator. Forecasts for the continuation of the bullish run into the area of $12,400 are still relevant. On the other hand, strengthening sales below the moving average line of EMA55 may lead to a breakout of the 50% fibo support ($11,394).
Bitcoin is trading at $11,920 at press time.
ETH/USD
After a one-year high around $445, the Ethereum (ETH) price rolled back to support the two-hour EMA55. On Sunday, buyers tried to restore the pair to the high zone, but trading volumes were low and the price was unable to rise above the $440 level.
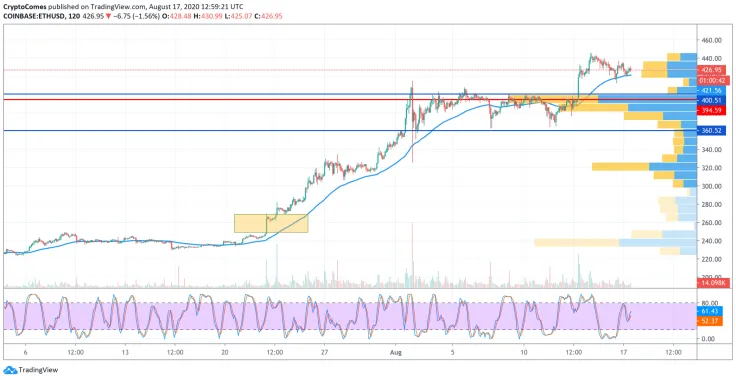
Sellers returned the altcoins to the area of average prices tonight. While there is no strong bearish pressure, one can count on the support of the EMA55 moving average and the renewal of the annual high to $480. However, if sales volumes increase and sellers break through the 2-hour EMA55, then the price may retrace below the psychological level of $400.
Ethereum is trading at $427.47 at press time.
XRP/USD
On the weekend, buyers made several attempts to break through the upper border of the sideways range, but at low volumes. The price could not overcome the resistance of $0.31. Sellers managed to pierce the support of the two-hour EMA55, but by the end of last week, XRP could hold above the average price level.
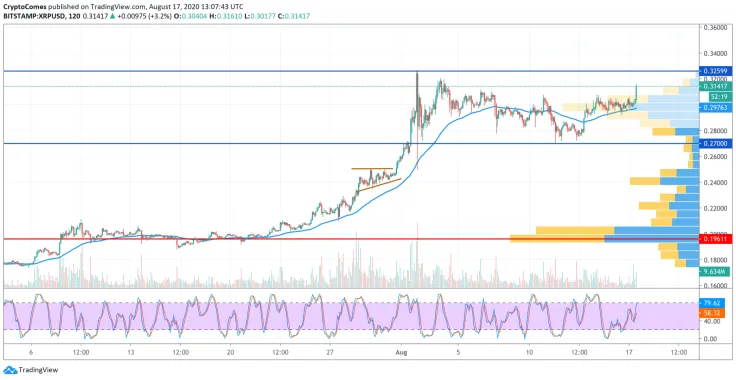
If trading volumes start to grow, buyers will continue to try to break through the resistance and set a maximum around the $0.320 mark. If the support for the moving average EMA55 is broken, sellers might test the lower border of the wide sideways range of $0.280.
XRP is trading at $0.3152 at press time.
LINK/USD
Chainlink (LINK) keeps growing after it has successfully fixed in the Top 5 list of the most popular cryptocurrencies. The rate of the altcoin has risen by 2% over the previous 24 hours.
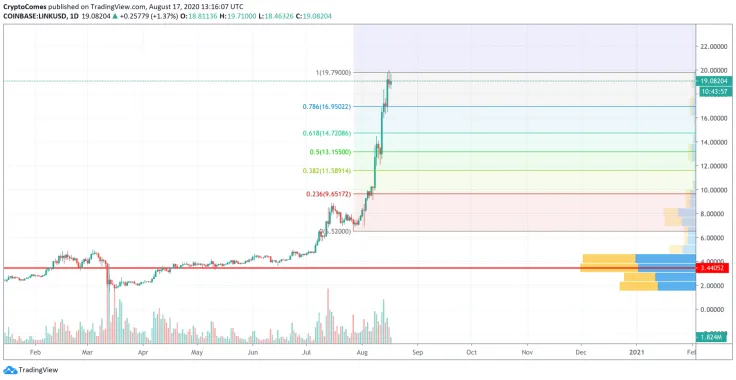
Despite ongoing slight growth, our recent Chainlink (LINK) price forecast remains relevant and the correction might start soon before further growth continues. Applying the Fibonacci retracement on the chart, the decline may last until it reaches 61.8%, which applies to the $14.72 mark. Such a scenario may happen by the end of the current month.
Chainlink is trading at $18.80 at press time.
BCH/USD
Bitcoin Cash (BCH) is one of the top gainers from our list. The rate of BTC's fork has increased by almost 5% since yesterday.
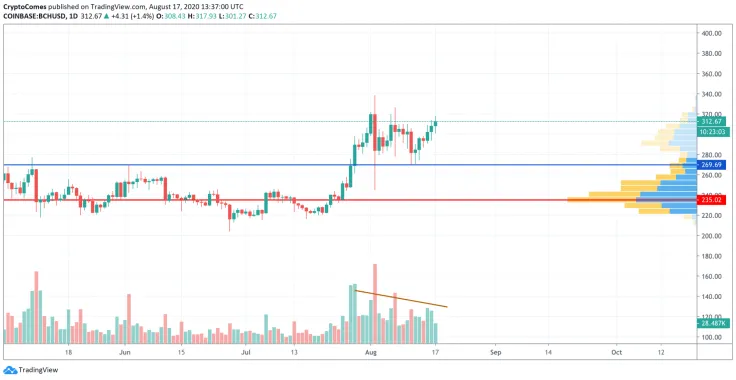
On the daily chart, Bitcoin Cash (BCH) has been growing since Aug. 10. However, that price rise was not accompanied by a rising trading volume. It means that there is a high possibility of a correction soon. Also, liquidity is low, which is also a prerequisite for a decrease. In this regard, the drop may be to the support at around $270.
Bitcoin Cash is trading at $313.69 at press time.
LTC/USD
Litecoin (LTC) is the fastest growing coin from today's list. The "digital silver" has rocketed by 7.16% over the last day while the price change over the previous week has constituted +11.20%.
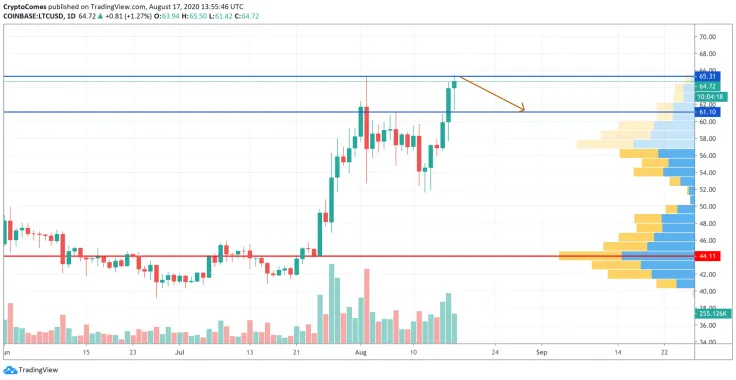
Litecoin (LTC) has confirmed the bullish scenario on the daily time frame. However, it is unlikely to break the resistance at $65.30 for the first time. The last time the "digital silver' touched this level was Aug. 2, which means that buyers have little chance of breaking the far retest level. That is why a sharp correction to the $61 support level is possible before growth continues.
LTC is trading at $64.82 at press time.

 Vladislav Sopov
 Dan Burgin