
Disclaimer: The opinions expressed by our writers are their own and do not represent the views of U.Today. The financial and market information provided on U.Today is intended for informational purposes only. U.Today is not liable for any financial losses incurred while trading cryptocurrencies. Conduct your own research by contacting financial experts before making any investment decisions. We believe that all content is accurate as of the date of publication, but certain offers mentioned may no longer be available.
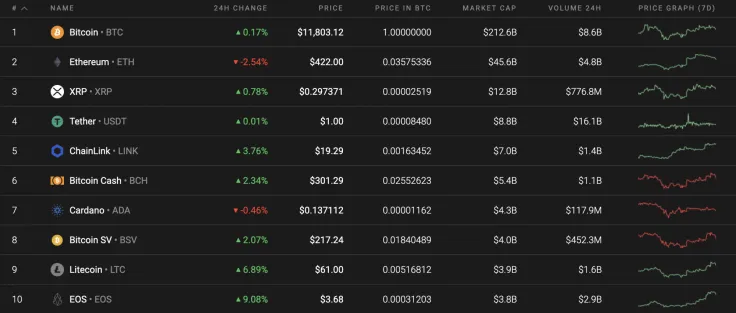
The rates for most of the Top 10 coins do not change much over the weekend. Ethereum (ETH) and Cardano (ADA) are the only two cryptocurrencies located in bearish territory at the moment.
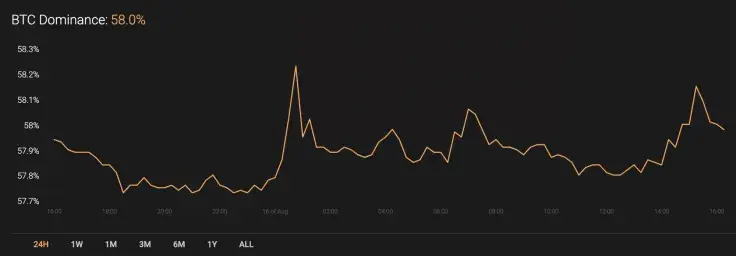
The dominance rate for Bitcoin (BTC) has remained in the same position since yesterday, and its current market share makes up 58%.
Below is the relevant data for Bitcoin (BTC) and how it's looking today:
-
Name: Bitcoin
Advertisement -
Ticker: BTC
-
Market Cap: $218,155,824,886
-
Price: $11,816.15
Advertisement -
Volume (24H): $21,395,829,268
-
Change (24H): 0.07%
The data was relevant at press time.
BTC/USD: Could a Retest of $12,000 Happen Next Week?
Compared to previous weeks, the current week was not a positive one for the leading cryptocurrency. Bitcoin (BTC) has only gone up 1.37% in price over the last 7 days.
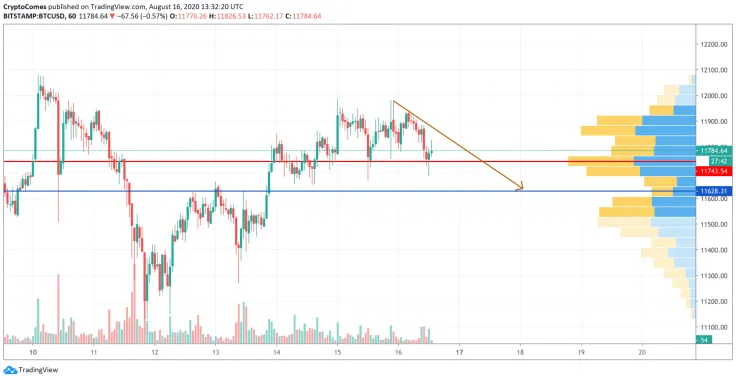
Bitcoin (BTC) has continued to correct itself after failing to fix above the $12,000 mark. Although the liquidity is still high, the buying trading volume has decreased, showing a lack of interest from the bulls to continue their rise in price. From a technical standpoint, the drop is not at an end and the decline may last until bears reach the $11,600 mark.
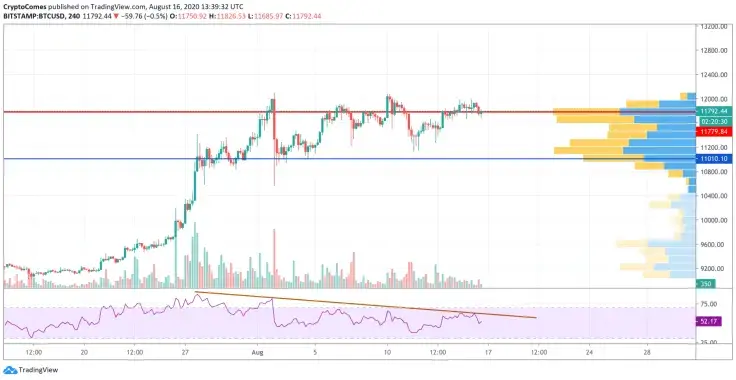
Looking at the bigger time frame, the bearish tendencies are even more powerful. There are almost no buyers at the moment who want to purchase Bitcoin (BTC) at the current prices and the trading volume is low.
There is also a divergence on the Relative Strength Index (RSI), which considers a further decline. In this regard, the closest bounce off level is at the $11,000 mark.
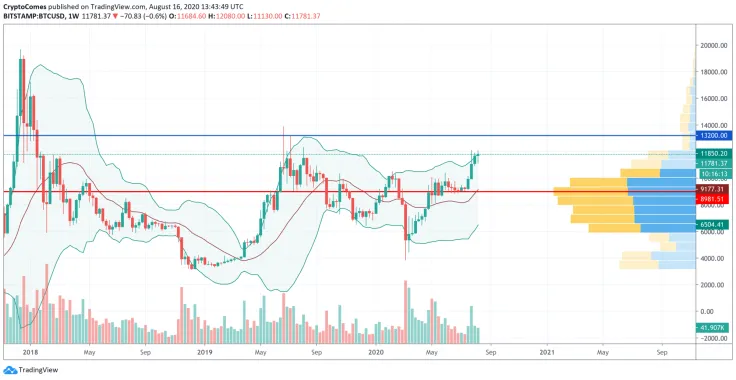
Looking at the weekly time frame, Bitcoin (BTC) is aiming towards the resistance at the $13,200 mark as the price has not decreased since breaking out from its long consolidation period. The trading volume is also at a relatively high level, which means that buyers may attain the aforementioned area despite possible corrections along the way.
At press time, Bitcoin was trading at $11,787.
 Dan Burgin
 U.Today Editorial Team