
Disclaimer: The opinions expressed by our writers are their own and do not represent the views of U.Today. The financial and market information provided on U.Today is intended for informational purposes only. U.Today is not liable for any financial losses incurred while trading cryptocurrencies. Conduct your own research by contacting financial experts before making any investment decisions. We believe that all content is accurate as of the date of publication, but certain offers mentioned may no longer be available.
Cryptocurrency market volatility has remained low. We cannot exclude the development of a strong impulse movement in many of the fixed assets, which could disrupt the sideways trend.
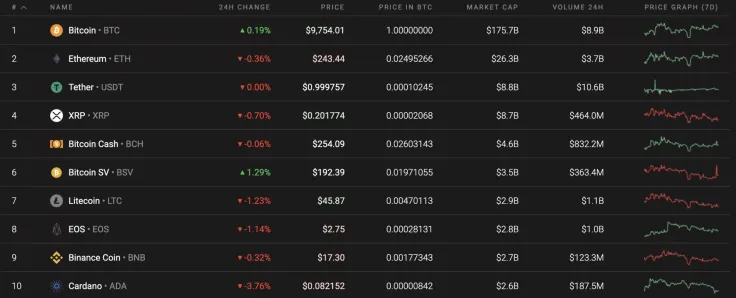
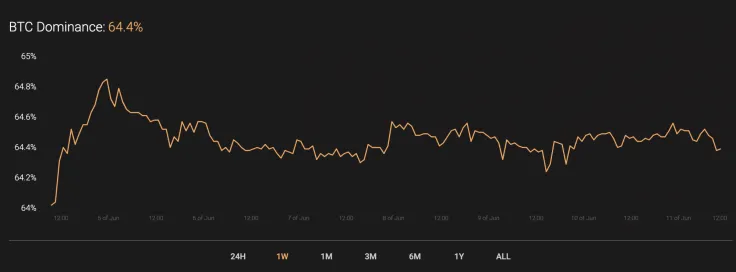
At the same time, the dominance rate of Bitcoin (BTC) has increased and now amounts to 64.4%.
The relevant data for Bitcoin is as follows.
-
Name: Bitcoin
Advertisement -
Ticker: BTC
-
Market Cap: $180,631,492,177
-
Price: $9,816.36
Advertisement -
Volume (24h): $26,494,837,371
-
Change (24h): 0.61%
The data is relevant at press time.
BTC/USD: Can bulls expect new local highs in Summer 2020?
For Bitcoin (BTC), $10,565 is still very important, the breakdown of which would indicate a move to $13,000 and higher. However, if bears manage to break through the next support levels, $6,500 will be the target of a downward impulse.
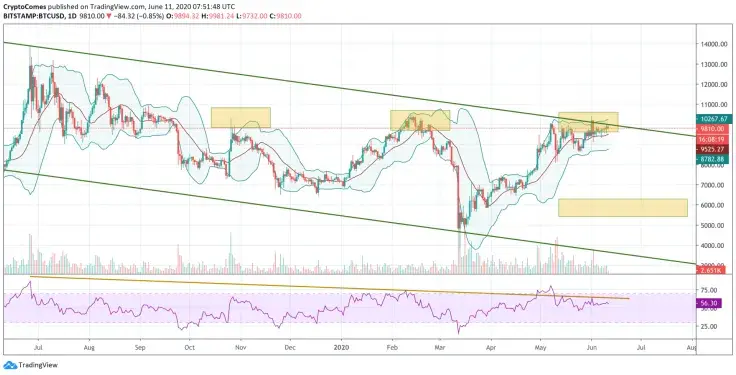
BTC/USD quotes have remained below the resistance level. It is crucial for buyers to break $10,565, for the resumption of the bullish trend to begin. Such a scenario would also indicate a breakdown of the upper boundary of the downward channel. If the price falls below $8,545, then it is worth considering this structure as a “Double Top” reversal model with the goal of reaching $6,320. In favor of this scenario is the price rebound from the upper boundary of the downward channel, as well as the fact that the RSI indicator values could not gain a foothold over the resistance line. These factors indicate strong pressure from the bears.
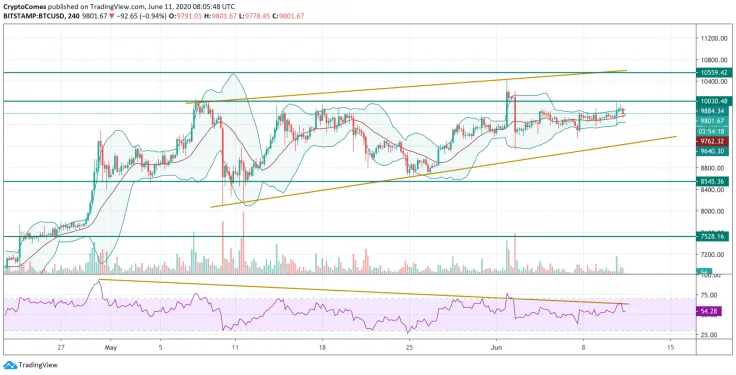
On the 4H chart, quotes are located between support and resistance levels. Previously, there was potential for the formation of a “Head and Shoulders” reversal model, which could take the price down, but at the moment the “right shoulder” of the model is noticeably higher, which could stop the formation of this pattern and continue the price growth.

As a short-term trading idea, we cannot exclude another test of $10,000 and the beginning of a fall to $9,270. A breakdown of the latter would open up the way to $8,555. If bulls manage to push the price above $10,055, a continuation of the rise to $10,565 and the resumption of the upward trend on the daily chart of the asset is possible.
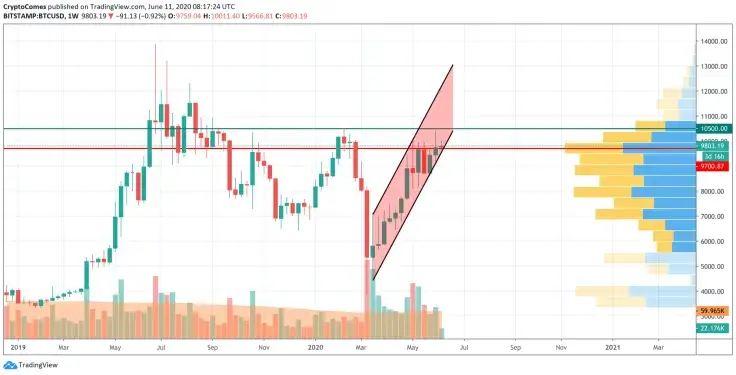
On the weekly chart, Bitcoin (BTC) keeps trading within the narrow ascending channel. The trading volume is dropping slowly. However, the liquidity remains at a relatively high level. As we can see, the current candle is located above the previous one which means that bears were not able to seize the initiative for the long-term prospective. To keep rising, buyers need to hold the price above $10,000. Otherwise, the trend will turn bearish.
Bitcoin is trading at $9,810 at press time.
 Dan Burgin
 U.Today Editorial Team