Disclaimer: The opinions expressed by our writers are their own and do not represent the views of U.Today. The financial and market information provided on U.Today is intended for informational purposes only. U.Today is not liable for any financial losses incurred while trading cryptocurrencies. Conduct your own research by contacting financial experts before making any investment decisions. We believe that all content is accurate as of the date of publication, but certain offers mentioned may no longer be available.
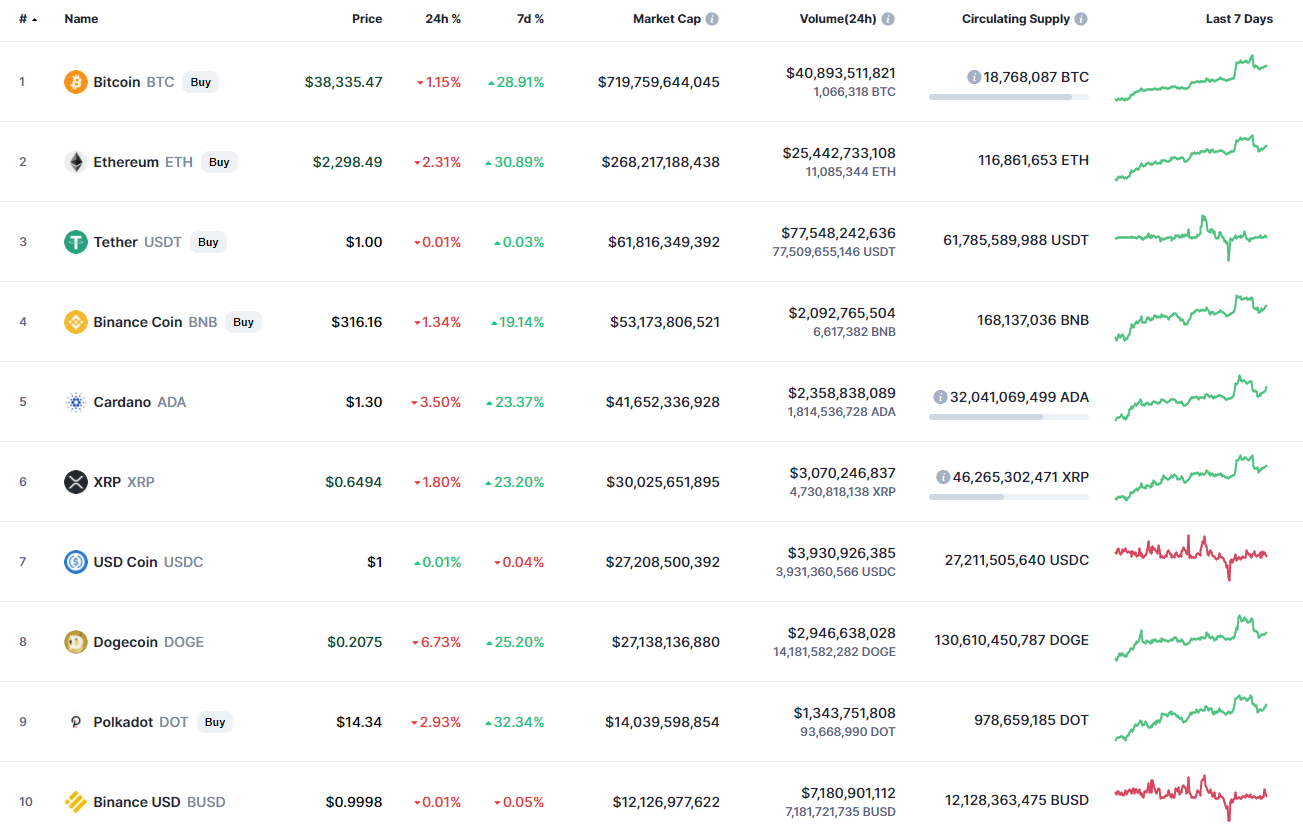
The market has faced a slight decline after a few days of growth, and the majority of the coins are again red.
BTC/USD
The Bitcoin (BTC) price found support at $38,000 yesterday morning. During the day, sellers tried to pierce this support several times, but in the evening, the volume of purchases increased and the bulls were able to renew the monthly high around the $40,580 mark.
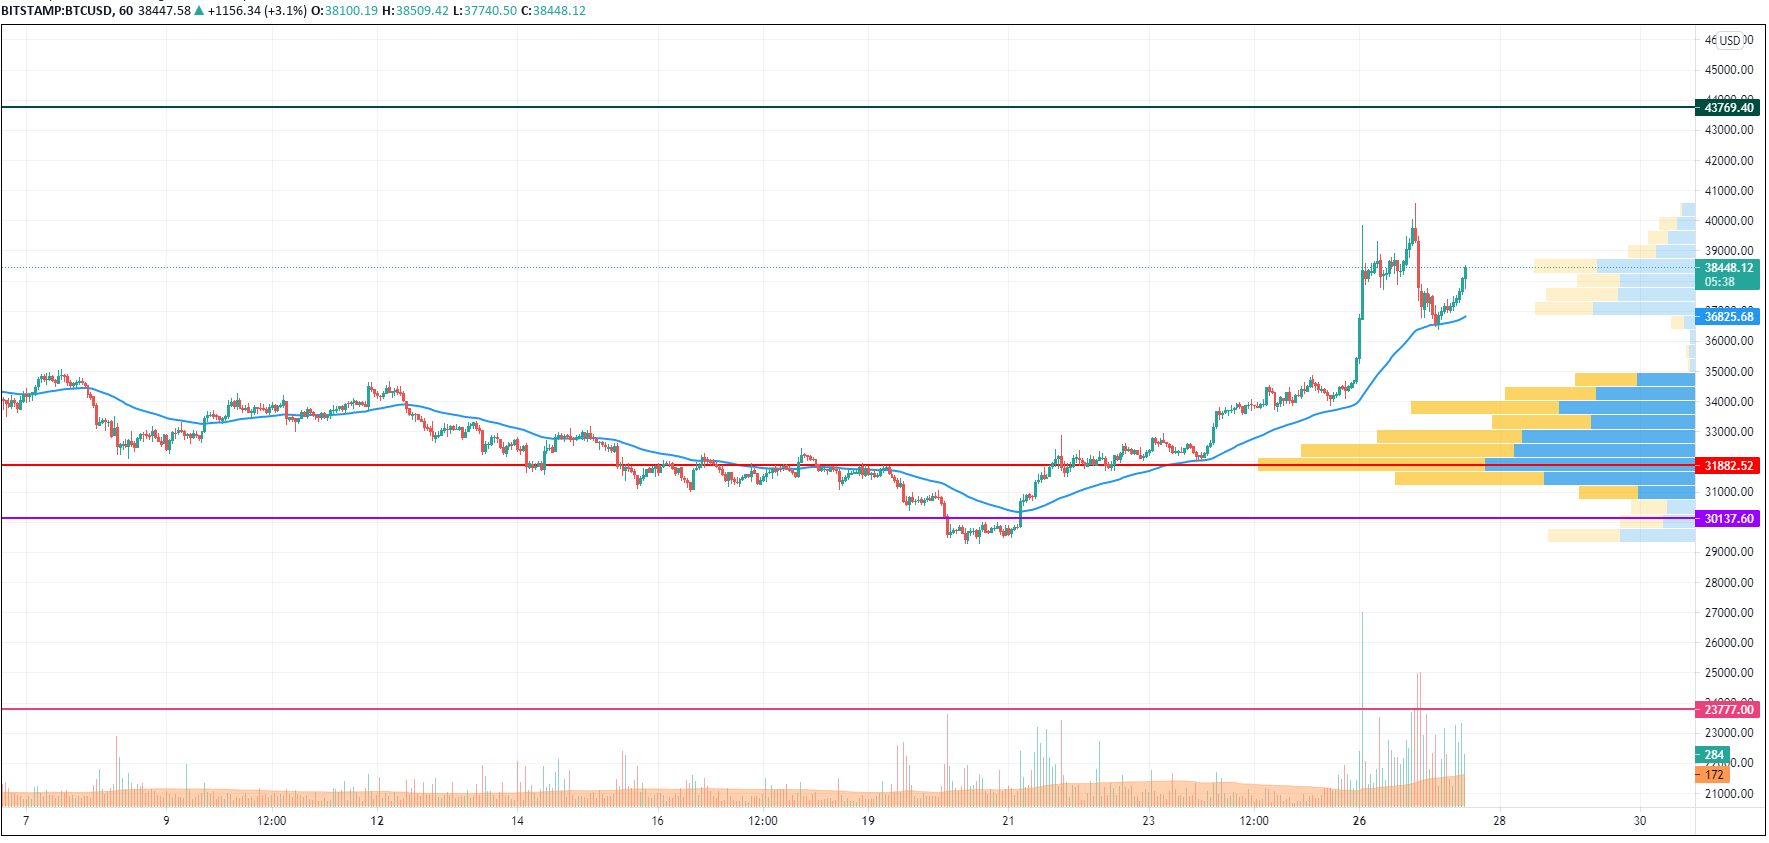
The bears responded with tough pressure and, overnight, brought the BTC price back to the $37,150 level. In the morning, bearish pressure eased, but the price continued to decline to the hourly moving average EMA55.
The level of average prices has stopped the decline, and it is possible that buyers may try to bring the pair back to the July high.
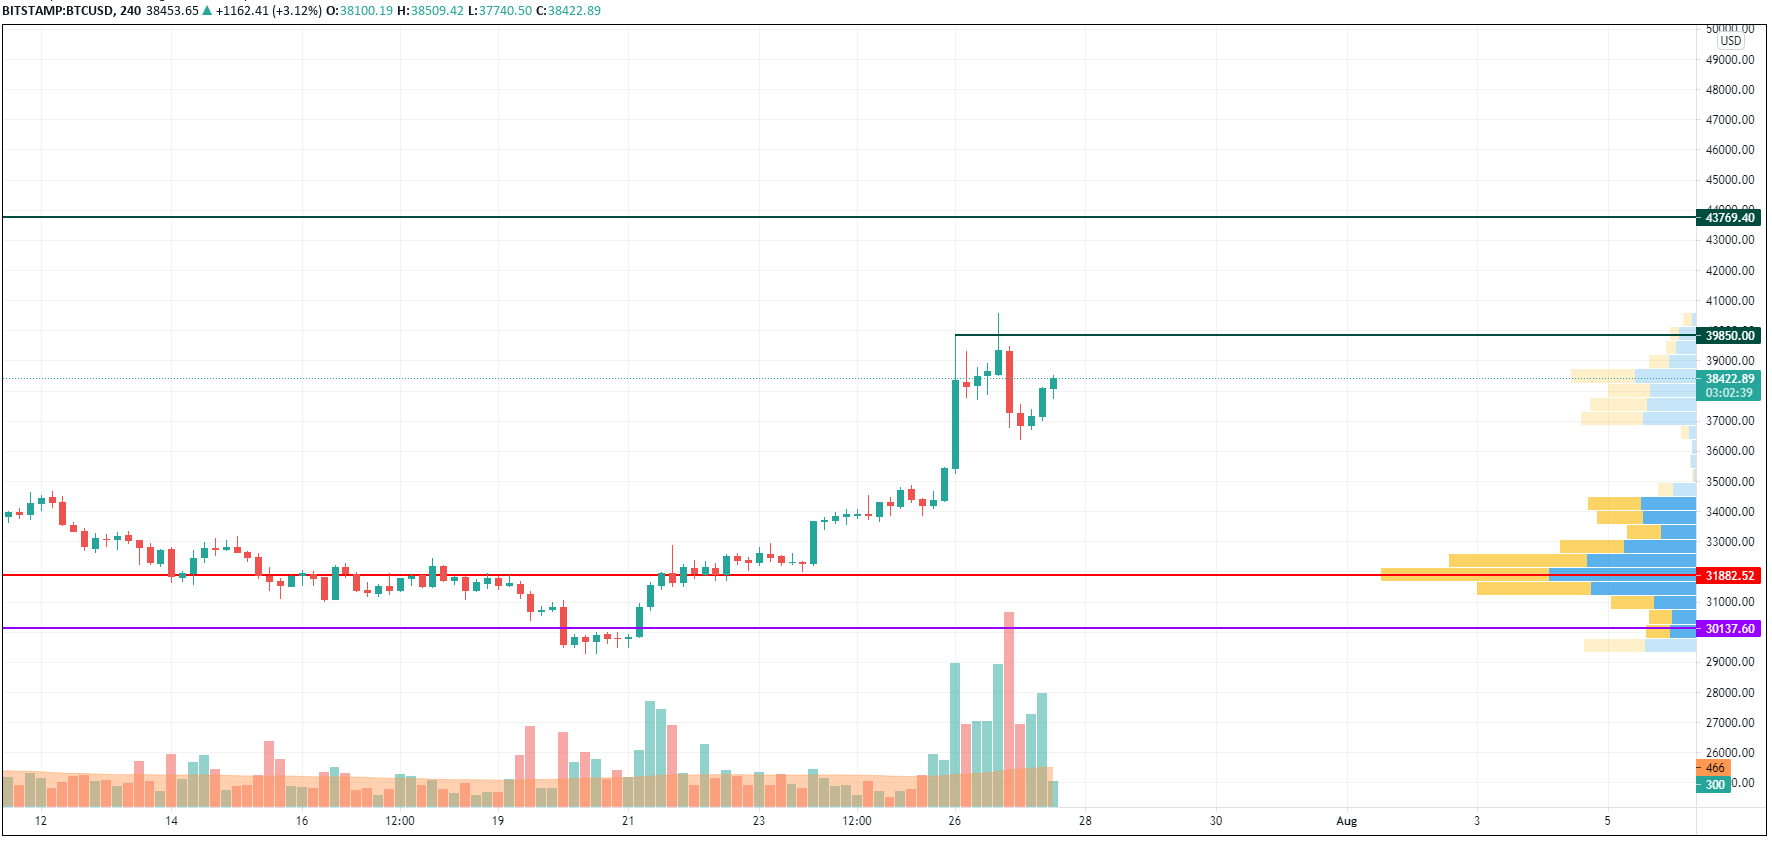
On the 4H chart, Bitcoin (BTC) is coming back to the formed level at $39,850. The rise is not supported by high trading volumes, which means that traders are sill accumulating power. In this case, there is a high possibility of expect the breakout of the resistance soon.
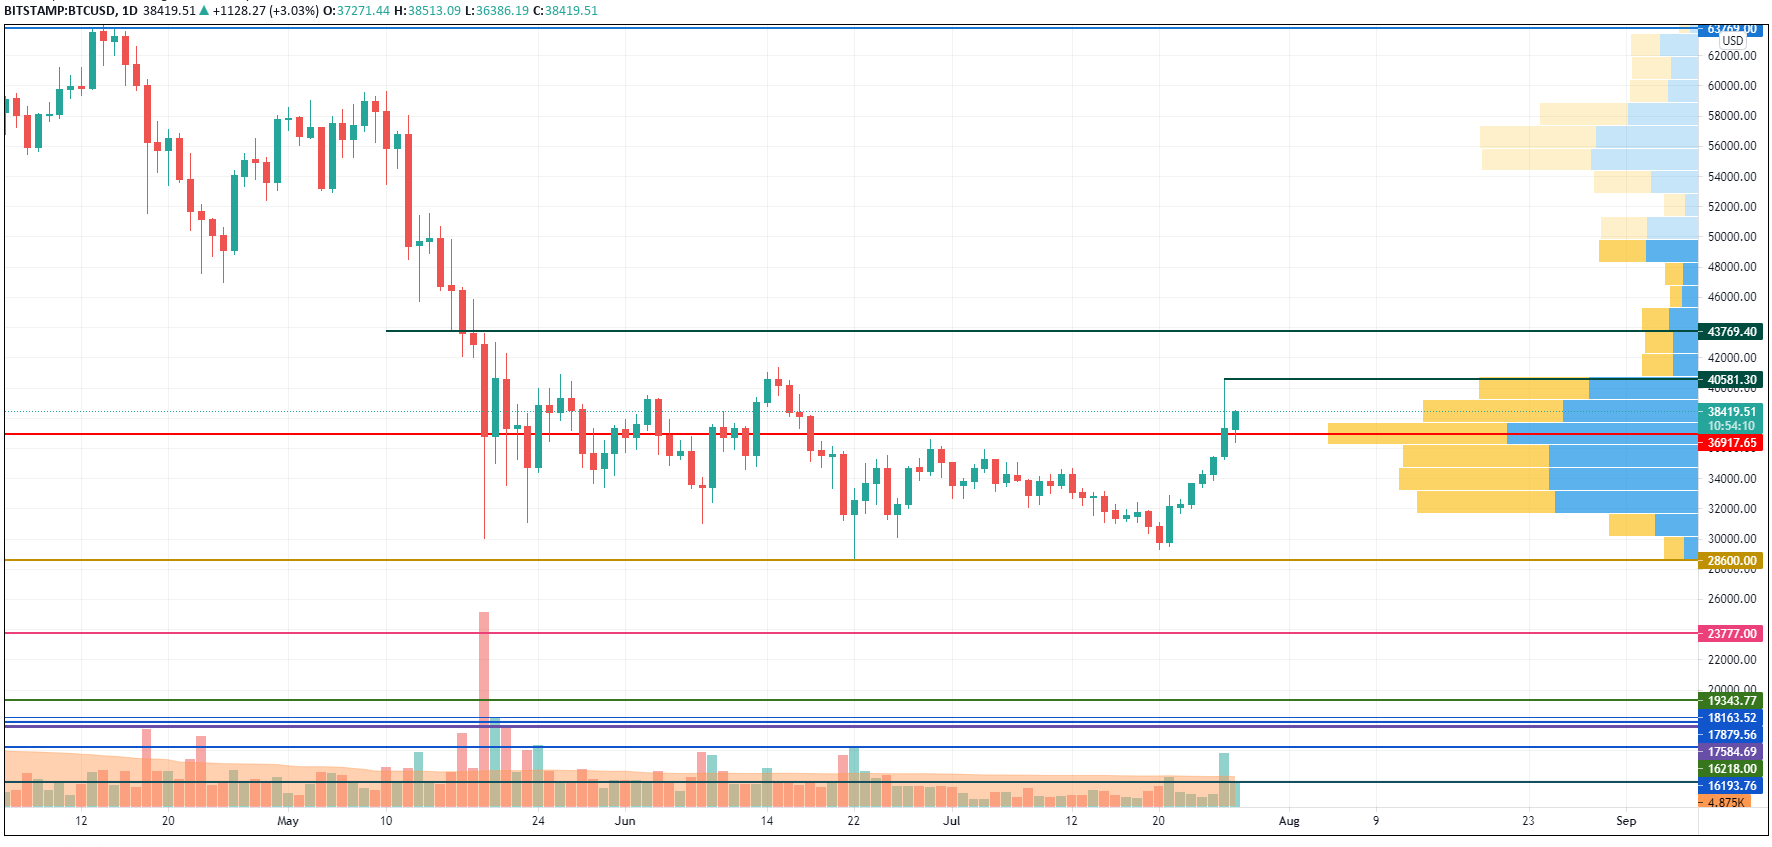
According to the daily chart, the leading cryptocurrency will not fall after a rejection from the zone around 40,000. The liquidity is high at the current area, confirming the accumulation phase before a possible breakout. If that occurs, the next resistance at $43,700 might be achieved within the next few days.
Bitcoin is trading at $38,370 at press time.
 Dan Burgin
 U.Today Editorial Team