
Disclaimer: The opinions expressed by our writers are their own and do not represent the views of U.Today. The financial and market information provided on U.Today is intended for informational purposes only. U.Today is not liable for any financial losses incurred while trading cryptocurrencies. Conduct your own research by contacting financial experts before making any investment decisions. We believe that all content is accurate as of the date of publication, but certain offers mentioned may no longer be available.
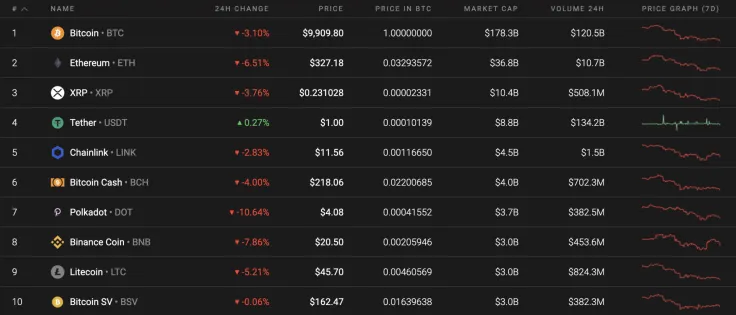
The situation on the cryptocurrency market is almost unchanged since the weekend. All Top 10 coins continue trading in the red zone, while the main loser is Polkadot (DOT)—whose rate has declined by 10%.
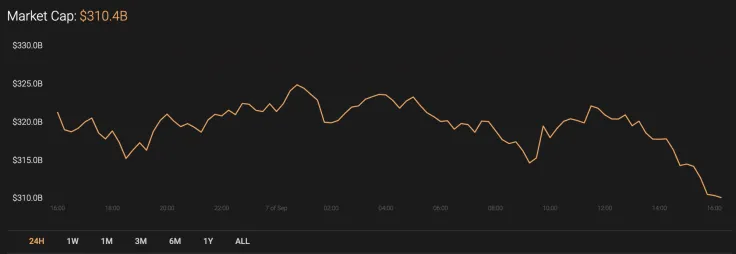
Total cryptocurrency market capitalization keeps going down. The decline over the last day has involved $10 bln, and market cap currently sits at $310.4 bln.
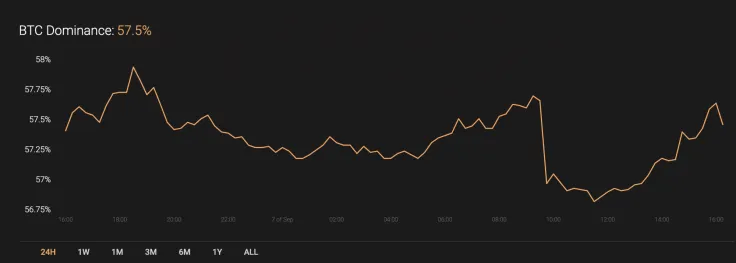
Analyzing the market share of Bitcoin (BTC) reveals that its dominance rate remains in the same place as yesterday.
The relevant data of Bitcoin looks the following way today:
-
Name: Bitcoin
-
Ticker: BTC
-
Market Cap: $184,315,279,740
Advertisement -
Price: $9,972.65
-
Volume (24h): $36,955,030,960
-
Change (24h): -1.80%
The data is relevant at press time.
BTC/USD: Is Bitcoin (BTC) going to test the $9,500 mark?
On Saturday, the selling pressure did not ease and, at the end of the day, the Bitcoin (BTC) price renewed its weekly low at $9,850.
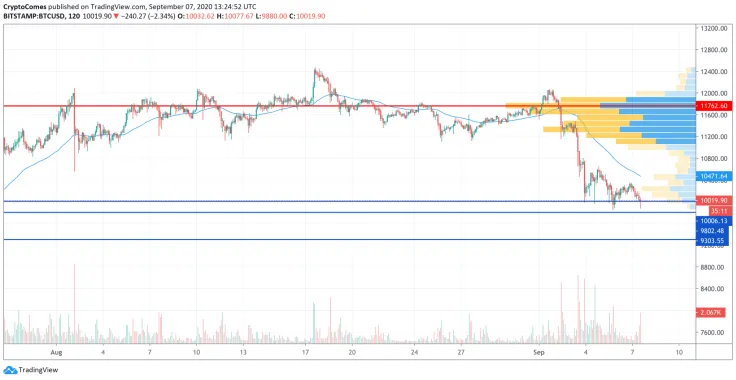
When the volume of sales decreased, buyers immediately restored the price above the psychological level of $10,000. On Sunday, trading was held at reduced volumes, and the pair consolidated above the level of $10,100. The recovery was limited to a surge in price to the level of $10,350. Bulls failed to return to the area of average prices ($10,500).
At the beginning of this week, the decline may continue to support 38.2% Fib ($9,441). In the corridor of $9,300-$9,800, the pair can gain a foothold in sideways consolidation.
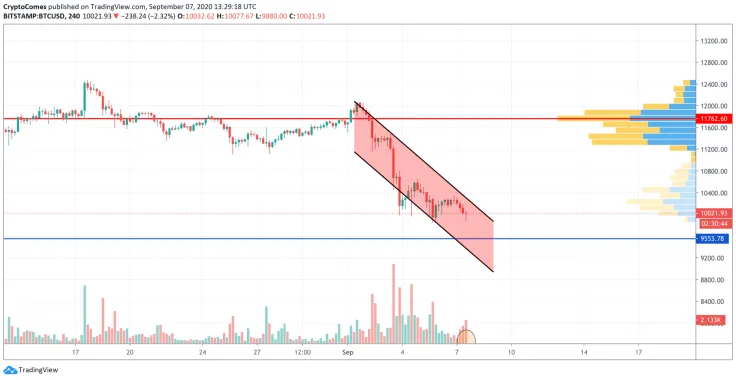
On the 4H time frame, bears keep controlling the situation. This is confirmed by the increasing selling trading volume. Thus, Bitcoin (BTC) has been trading within the falling channel since Sept. 1. The decline may stop when the main crypto attains the local support at around $9,550.
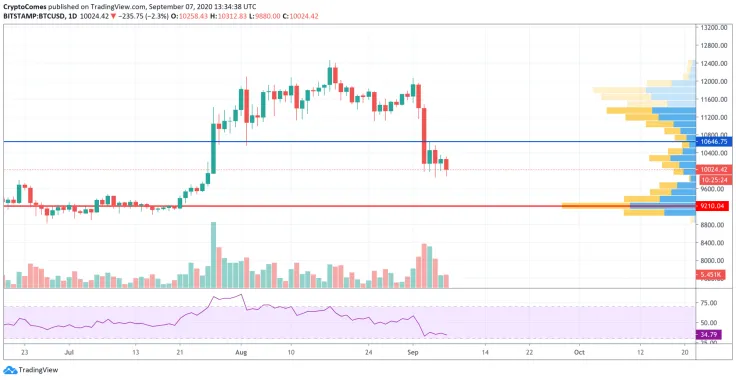
On the larger chart, a reversal may happen soon as the value of the RSI indicator has almost attached the oversold area. What's more, the trading volume is declining, which means that sellers are losing their initiative. To conclude, a bounce off may bring the rate of Bitcoin (BTC) to $10,600.
Bitcoin is trading at $10,037 at press time.
 Dan Burgin
 U.Today Editorial Team