
Disclaimer: The opinions expressed by our writers are their own and do not represent the views of U.Today. The financial and market information provided on U.Today is intended for informational purposes only. U.Today is not liable for any financial losses incurred while trading cryptocurrencies. Conduct your own research by contacting financial experts before making any investment decisions. We believe that all content is accurate as of the date of publication, but certain offers mentioned may no longer be available.
The cryptocurrency market is a dynamic ecosystem that evolves rapidly. As an investor or a crypto enthusiast, it is essential to keep tabs on critical metrics that can inform one's understanding of the underlying forces at play. One such token that has been in the spotlight lately is XRP. An intriguing pattern emerges when you delve into XRP's volume profile, as illustrated by the data from Messari.
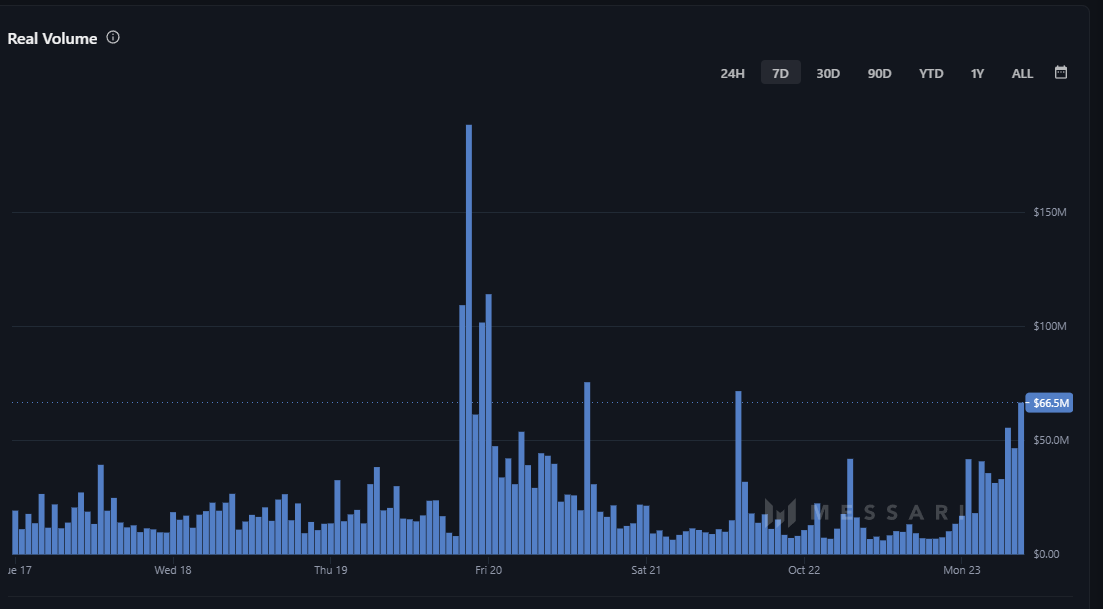
To begin with, the volume profile chart by Messari reveals an interesting concentration of trading volume at specific price points. The most notable spike is observed at a point where a considerable amount of XRP changed hands. This could potentially indicate strong interest or conviction by traders in this particular price range. When large volumes are traded at certain levels, it typically suggests that these levels are of significance, either as support or resistance.
Turning our attention to the daily chart of XRP, we can further dissect its price action. The chart demonstrates periods of consolidation, followed by sharp upward or downward moves. Recently, there appears to be a slight upward trend, with the price touching and bouncing off key moving averages. These moving averages act as dynamic levels of support and resistance. Furthermore, the confluence of the price's upward trajectory with the volume spike could signify an accumulation phase, where institutional or large-scale traders might be amassing positions. However, as with all analyses, this inference needs to be taken with a grain of salt and wait for further confirmation.

The adjusted NVT ratio, which stands for Network Value to Transactions, provides an insight into the valuation of a cryptocurrency compared to the economic activity on its network. Essentially, a lower NVT ratio might suggest that the token is undervalued concerning its transactional activity. For XRP, if the adjusted NVT ratio is trending downward or remains low, it might hint at healthy economic activity on the XRP network relative to its market cap. Conversely, a high NVT ratio could indicate overvaluation.
 Dan Burgin
 U.Today Editorial Team