Disclaimer: The opinions expressed by our writers are their own and do not represent the views of U.Today. The financial and market information provided on U.Today is intended for informational purposes only. U.Today is not liable for any financial losses incurred while trading cryptocurrencies. Conduct your own research by contacting financial experts before making any investment decisions. We believe that all content is accurate as of the date of publication, but certain offers mentioned may no longer be available.
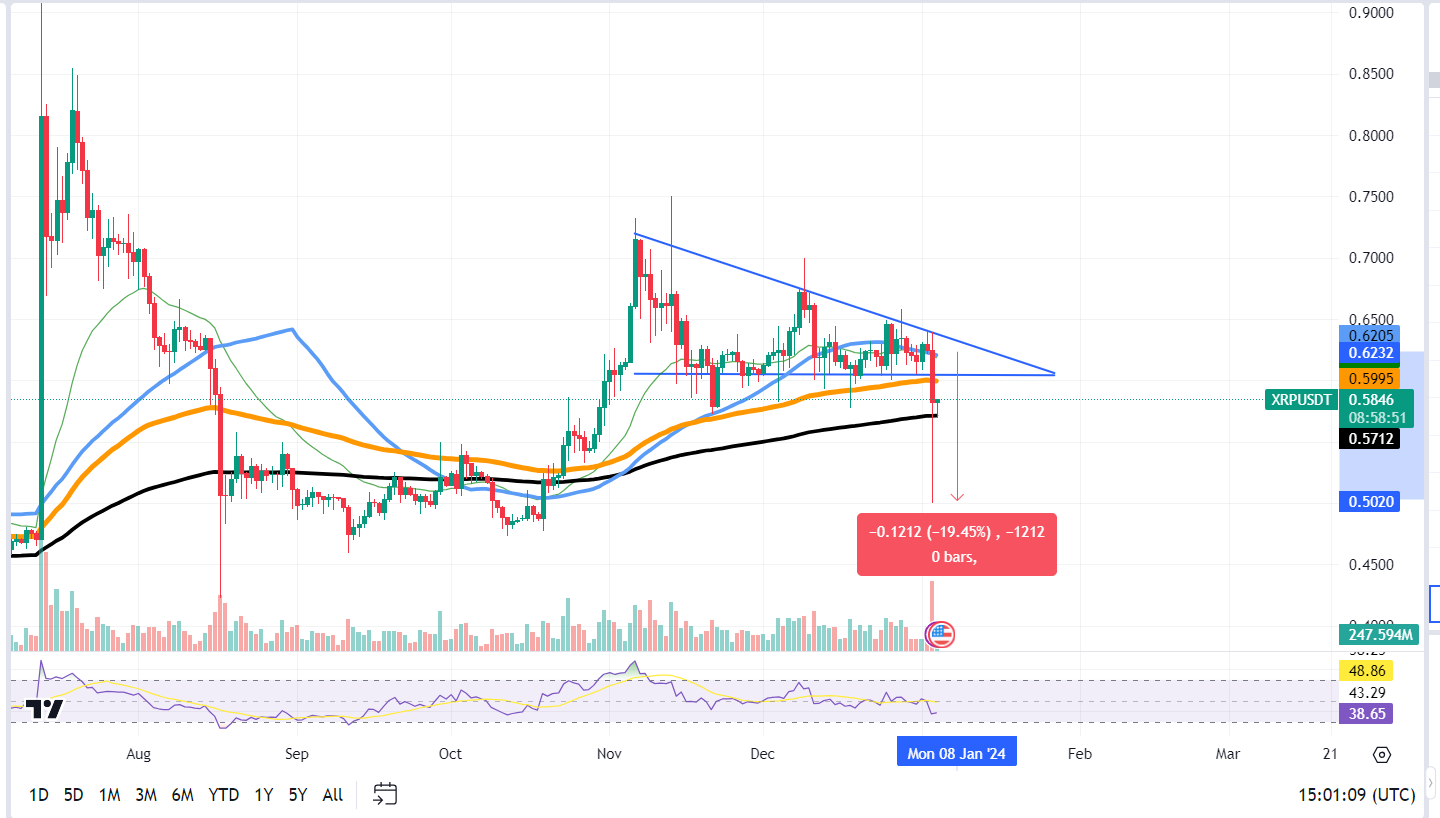
XRP has recently experienced a seismic price drop, one we have not seen since August. A massive price wick, as shown on the chart, liquidated millions of dollars worth of derivatives in less than an hour. This unexpected plunge has effectively erased the steady accumulation phase that XRP had been undergoing, catching traders off guard and disrupting numerous trading portfolios.
The chart analysis reveals that after a period of consolidation within a narrowing price range — a pattern that traders often interpret as accumulation — XRP broke down dramatically. The long downward wick signifies a sharp sell-off, pushing prices to plummet swiftly. Such price action is typically indicative of a market where sellers have overwhelmed buyers, leading to rapid liquidations as stop-loss orders are triggered en masse.
This sudden downturn has cast a shadow over XRP's short-term recovery prospects. With the accumulation phase nullified, the market must now grapple with the new reality of its invalidated bullish setups. This suggests that confidence in the asset's immediate growth potential has been significantly dented, and it may take some time for investor sentiment to rebuild and for the market to stabilize.

However, such drastic price movements often stir the market, leading to increased trading activity. The surge in volatility following such a drop could attract fresh funds and opportunistic traders looking to capitalize on the new lower price levels. Market participants might see this as a discount entry point, potentially injecting liquidity and driving some degree of price correction.
Ethereum gains strength against Bitcoin
A substantial number of analysts believe that the ETH/BTC chart is a pivotal indicator for gauging market risk exposure. Historically, it reflects Ethereum's performance relative to the more established Bitcoin. Until recently, this metric had been in decline, with Ethereum trailing behind Bitcoin and signaling a more cautious market sentiment toward Ethereum's future prospects.

However, the tides appear to be changing. The ETH/BTC pair has formed a "higher low" pattern. This pattern is significant as it often indicates a weakening of the previous downtrend, potentially preluding a reversal. The formation of a higher low suggests that Ethereum is gaining strength relative to Bitcoin, and could be a precursor to an upcoming rally.
The chart provided demonstrates this potential turning point. Ethereum's price, while still exhibiting volatility, shows signs of stabilizing and possibly gearing up for an upward move. The convergence of the moving averages and the leveling off of the RSI suggest that the selling pressure is abating, and the momentum could be shifting in favor of bulls.
If Ethereum can maintain this crucial higher low formation, it could entice risk-tolerant investors back into the market, bolstering the sentiment around the Ethereum ecosystem.
Shiba Inu is off the leash
Shiba Inu has seen its most substantial price drop since 2022. This hasty decline in SHIB's value has stunned investors and raised questions about the meme token's resilience and future.
The chart analysis of SHIB's recent price action shows a dramatic sell-off, with the asset breaking down below key support levels. The price wick, extending far below the consolidation zone, suggests a rapid and large-scale exit from the asset, resulting in millions worth of SHIB being sold in a short period. The sharp downturn not only startled the market but also effectively nullified the previous accumulation phase, throwing numerous trading setups into disarray.
The magnitude of this price drop could be a signal of a broader funds migration, with investors possibly steering away from high-risk meme coins like SHIB in favor of more established and "serious" assets. This shift may be part of a larger derisking trend within the crypto market, as participants seek stability amid economic uncertainty and regulatory scrutiny.
 Dan Burgin