Disclaimer: The opinions expressed by our writers are their own and do not represent the views of U.Today. The financial and market information provided on U.Today is intended for informational purposes only. U.Today is not liable for any financial losses incurred while trading cryptocurrencies. Conduct your own research by contacting financial experts before making any investment decisions. We believe that all content is accurate as of the date of publication, but certain offers mentioned may no longer be available.
The XRP/BTC weekly chart looks like it is about to change after the alternative cryptocurrency has been trading sideways against its main counterpart for the past few weeks, stuck in a tight range with less and less volatility.
The last time XRP consolidated like this was before the breakout in late 2024, when it surged against BTC after months of flat movement.
The Bollinger Bands are getting narrow. This does not mean that quotations of XRP against Bitcoin will definitely go up or down, but it is a sign that a bigger move is coming. The altcoin has tested the middle band many times and is now sitting pretty close to the lower end of its recent range, with buyers holding strong at 0.0000215-0.000022 BTC.
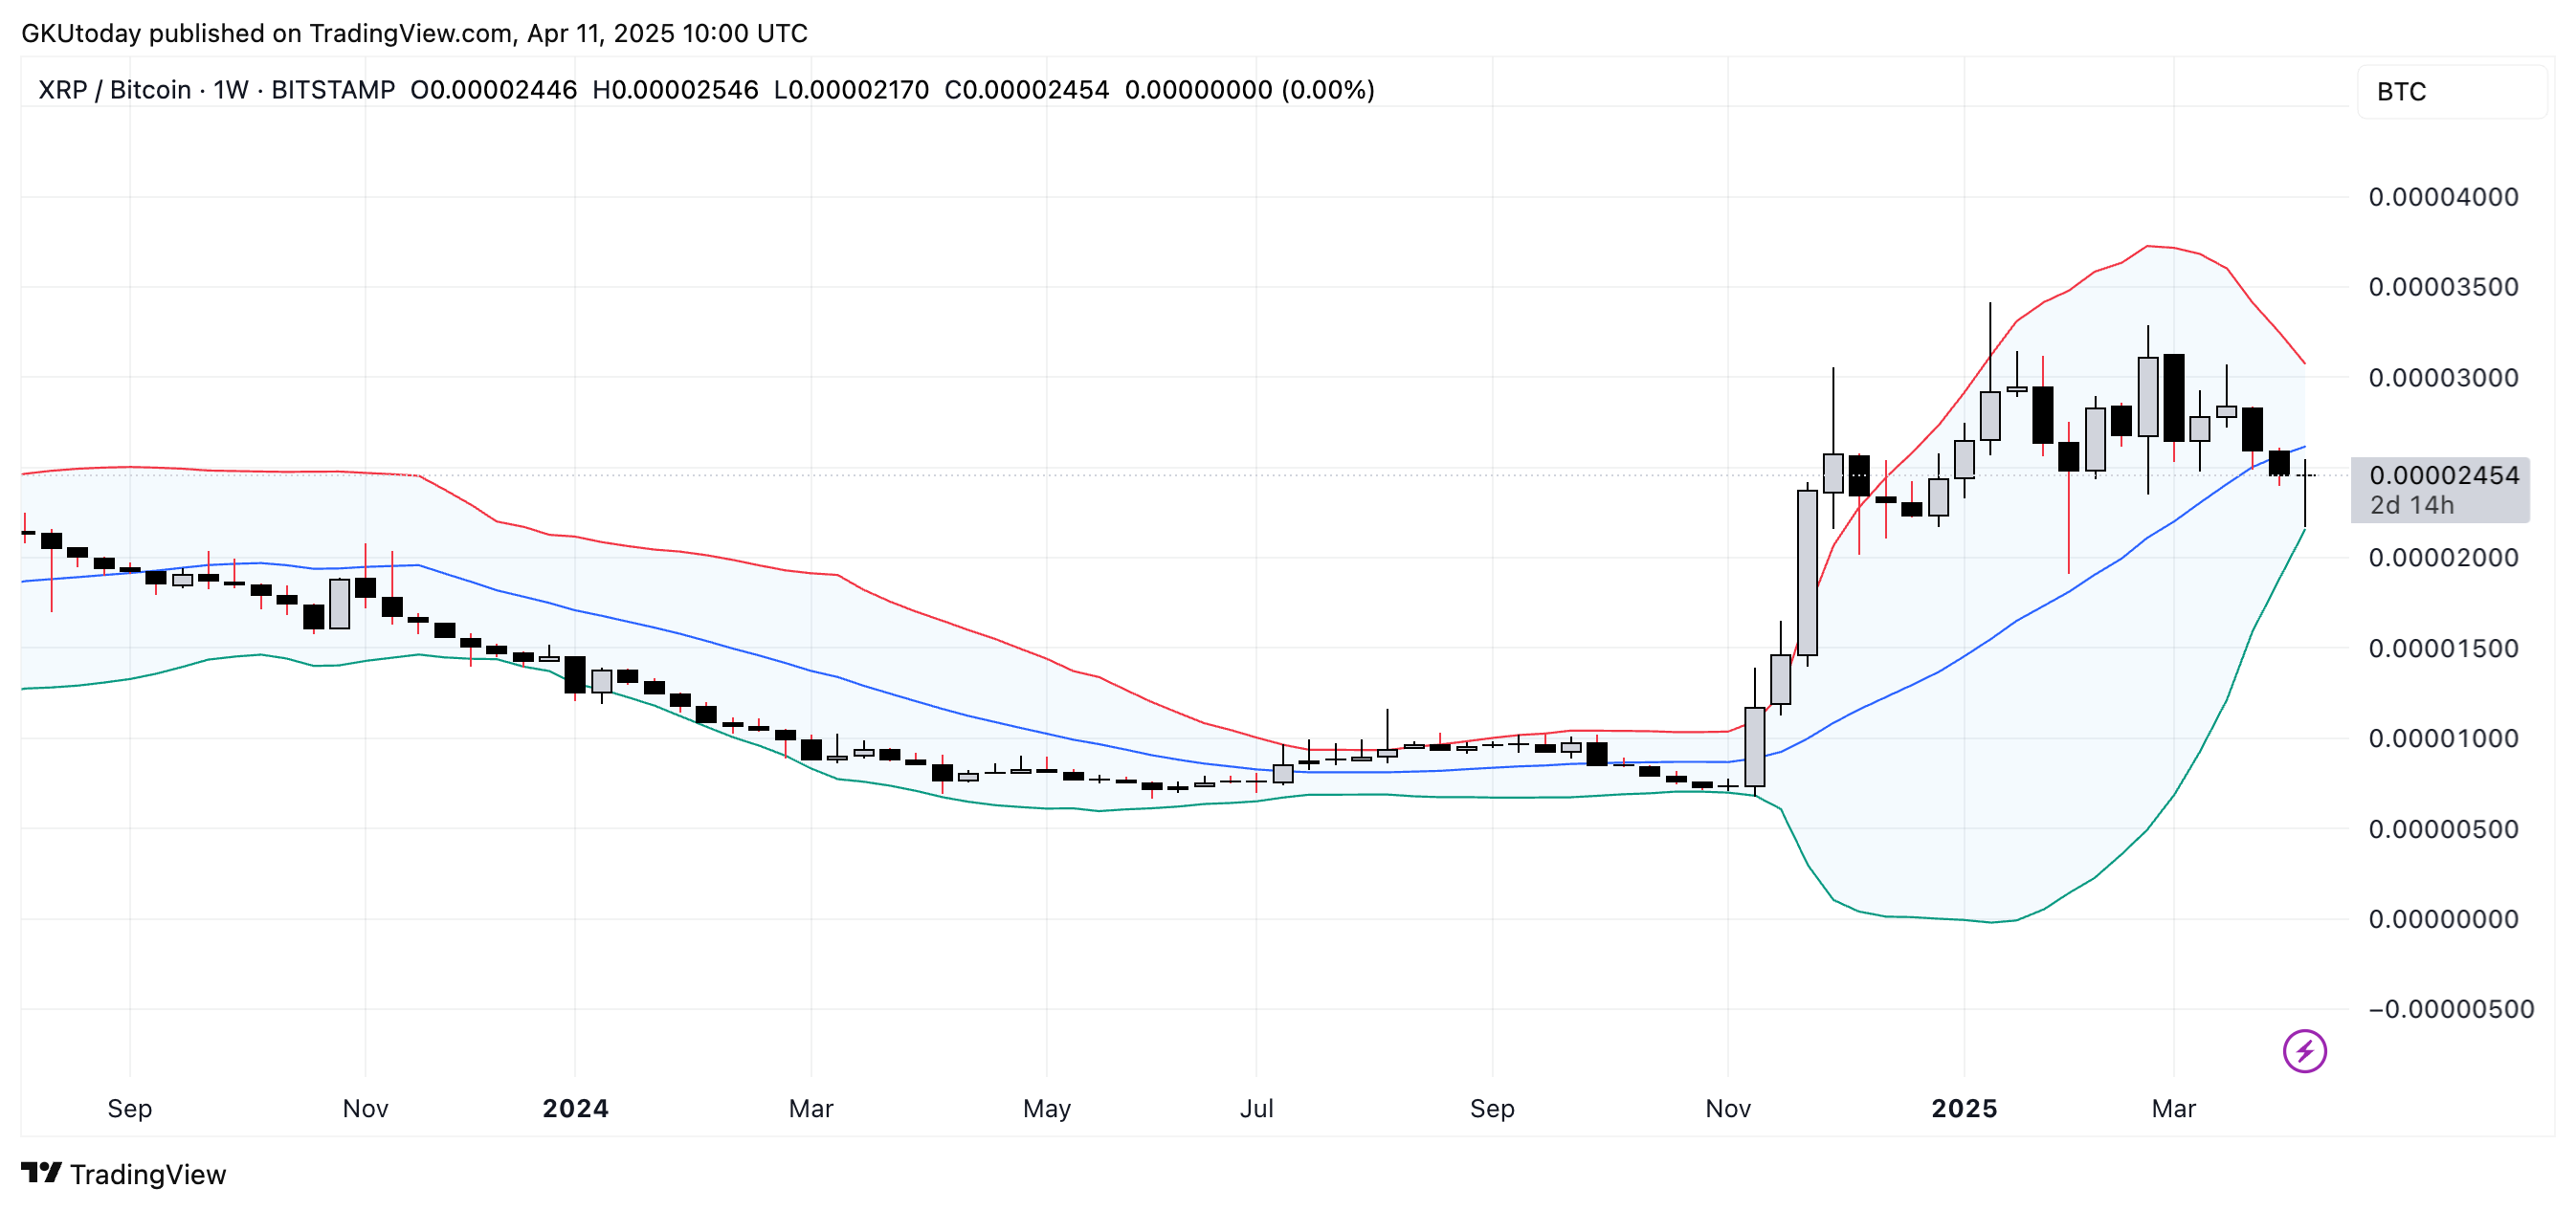
It has not broken down yet and is just holding steady, but if XRP can push back above 0.00002600 BTC and close above it, the upper range near 0.00003 BTC could open up again.
But if it does not, and it drops below the support level, it will probably move back toward the lower band. Right now, it is difficult to say which way the price will go, but one thing is certain: it will not stay neutral for long.

The broader market context — tariff problems, declining inflation, macroeconomic uncertainty — fits with the way XRP is behaving here. There is no real momentum either way. It is just pressure building.
For now, this chart is mostly about being patient. If you are watching the XRP/BTC ratio, you do not need to guess the direction, just stay alert and wait for the trigger to go off.
 Dan Burgin
 U.Today Editorial Team