Disclaimer: The opinions expressed by our writers are their own and do not represent the views of U.Today. The financial and market information provided on U.Today is intended for informational purposes only. U.Today is not liable for any financial losses incurred while trading cryptocurrencies. Conduct your own research by contacting financial experts before making any investment decisions. We believe that all content is accurate as of the date of publication, but certain offers mentioned may no longer be available.
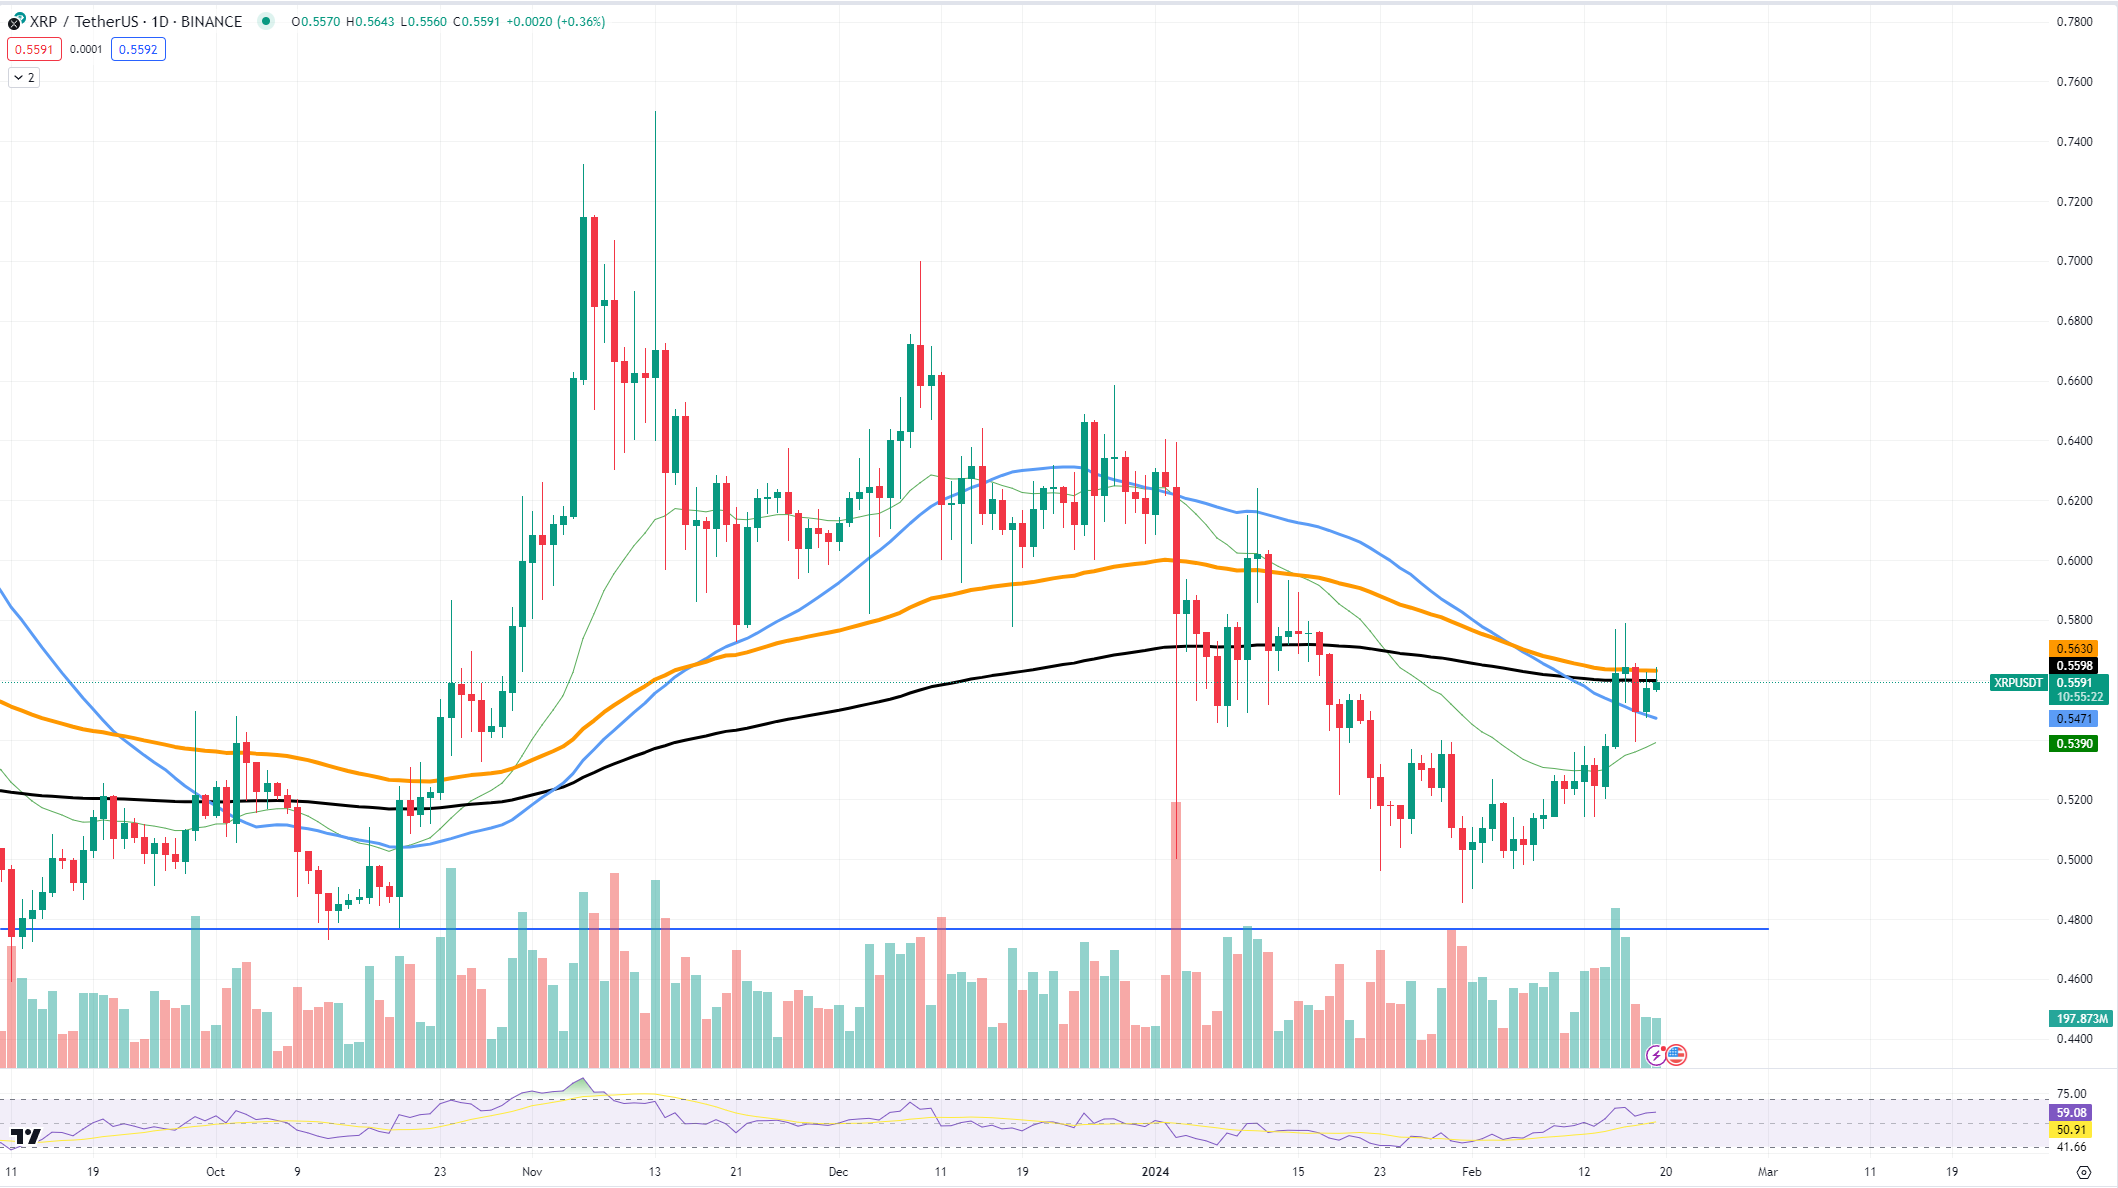
XRP's recent price trajectory has been met with a stark rejection, as it encountered a near-impenetrable resistance level that has halted its upward momentum. This resistance confluence is particularly formidable as it aligns with the 100, 50 and 200 EMAs, key technical indicators closely monitored by traders for significant price movements.
The current price level has proven to be a substantial barrier for XRP, as the EMAs have converged to form a tight band of resistance. This band has effectively capped the price, acting as a ceiling that XRP has struggled to breach. The close proximity of these EMAs indicates a critical decision point for the asset; a break above could signal a strong bullish turn, while continued rejection may cement the current level as a robust ceiling.

Further exacerbating the situation is the noticeable lack of trading volume. Volume acts as fuel for price movements, with higher volumes often associated with strong price action. The tepid volume accompanying XRP's approach to this resistance suggests a lack of conviction among buyers, which can often precede a price retreat.
From a technical perspective, the resistance zone around $0.58 to $0.60 is the area of interest. XRP's recent approach to this level was met with swift denial, indicating that overcoming this barrier will require a significant influx of buyer interest and volume.
On the support side, the $0.50 level is one to watch. It has served as a historical psychological and technical support level, providing a foundation for price rebounds in the past. Should XRP retreat, the response of buyers at this level could determine the asset's short-term fate.
Ethereum almost there
Ethereum is on the cusp of breaching the pivotal $3,000 mark, showcasing formidable strength in an otherwise tepid market. Its resilience and upward momentum may well act as a catalyst for broader market optimism.
The ascent toward $3,000 has been marked by consistent higher lows and higher highs, a bullish pattern that suggests strong buying interest at every dip. Technical indicators have turned favorable, with Ethereum recently pushing past the 50-day and 100-day EMAs — a sign that the momentum could sustain.
Support levels for ETH have been notably robust. The primary support at the $2,750 mark, which aligns with the 50-day EMA, has been defended well by the bulls. This level is critical as it has been tested multiple times, proving to be a springboard for subsequent rallies. On the upside, the psychological and technical barrier of $3,000 stands as the next significant challenge. A decisive close above this level could open the gates for further exploration into uncharted price territories, with potential intermediate resistance at $3,200.
ETH's exceptional performance can be partly attributed to the ongoing development within its ecosystem. The introduction of ERC-404, a new token standard that combines the versatility of NFTs with the fungibility of standard tokens, is an innovation that could further solidify Ethereum's position as the leading platform for decentralized applications.
Bitcoin faces opposition
Examination of the BTC chart reveals that the asset is experiencing a consolidation phase, which is often a precursor to a trend continuation rather than a sign of stagnation.
Currently trading above the $50,000 mark, Bitcoin has maintained a steady position near this psychological threshold. The consolidation phase is characterized by a narrowing price range, with Bitcoin oscillating between support and resistance levels that converge over time. This tightening of price movement is often associated with the accumulation of assets by traders and investors, setting the stage for a potential breakout.
The key support level for Bitcoin lies around the $48,000 area, which aligns with the 50-day EMA. This level has been tested and held firm on several occasions, indicating strong buying interest. On the flip side, the immediate resistance is located near the $53,000 mark. A convincing break above this level could signal a bullish continuation, potentially targeting previous highs or setting new records.


 Vladislav Sopov
 Dan Burgin