
Disclaimer: The opinions expressed by our writers are their own and do not represent the views of U.Today. The financial and market information provided on U.Today is intended for informational purposes only. U.Today is not liable for any financial losses incurred while trading cryptocurrencies. Conduct your own research by contacting financial experts before making any investment decisions. We believe that all content is accurate as of the date of publication, but certain offers mentioned may no longer be available.
The trading volume of Shiba Inu has been exhibiting an ascending dynamic, which suggests a critical reversal. This spike in volume suggests a growing interest in the asset, potentially signaling a change in market sentiment based on data from recent price charts.
SHIB experienced a retreat as a result of its inability to overcome its local resistance level. Still, a more important development is taking place: a higher low is being formed. For SHIB, this higher low formation is encouraging since it shows that the long-term declining trend may finally be ending.
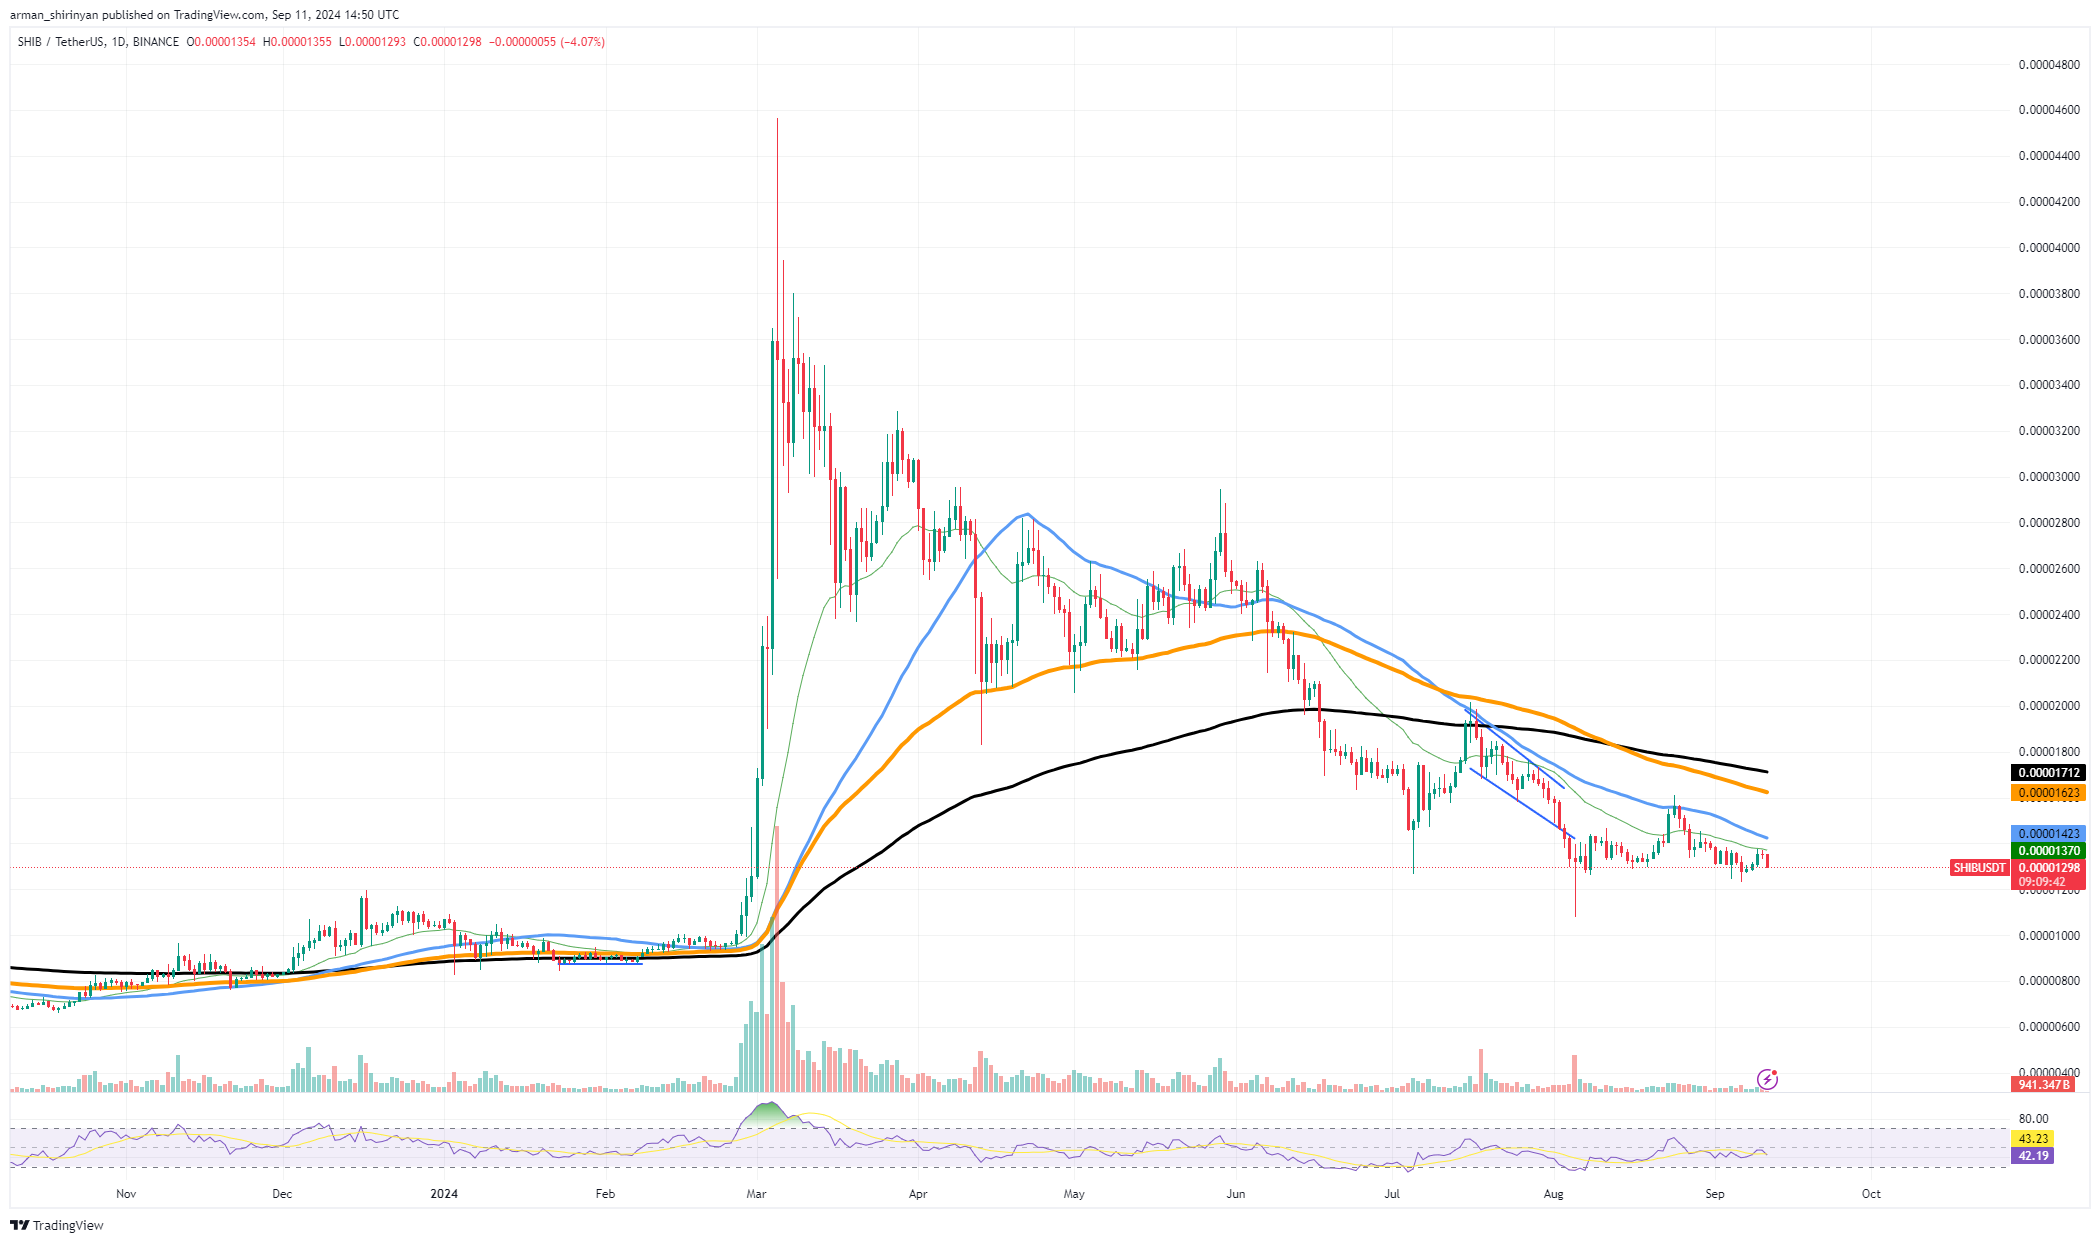
If this pattern continues, a higher low could signal the start of a longer-lasting recovery for Shiba Inu. Higher lows usually signal a change in the power dynamics from sellers to buyers. Observing the volume of transactions among major investors is another important consideration.
The direction of SHIB's price could be significantly impacted by this whale activity. Whale accumulation might provide the buying pressure required to overcome the current levels of resistance if it keeps up or gets stronger. In the near future, keep an eye on these three critical price levels for SHIB: the local resistance level at $0.0000135 is the one that SHIB is currently trying to breach.
A strong bullish trend would be indicated by a move above this level. SHIB must overcome this crucial resistance level of $0.00001712 in order to confirm a longer-term bullish run. By drawing in more customers, breaking this barrier would probably raise the price. The critical support level $0.00001124 must be maintained for SHIB to keep moving higher. Another bearish move could result from a break below this level.
Toncoin reversal gone
Though it was showing a strong upward trajectory and seemed to have breakthrough potential, Toncoin was brutally denied at the $5.5 level recently. Many traders anticipated that Toncoin would breach significant resistance levels following one of the biggest price increases on the entire digital asset market.
TON bulls were left scrambling, though, as the market had other ideas, and the bullish momentum soon dissipated. Although the digital asset has recently performed exceptionally well, the $5.50 denial indicates that the market is still under a lot of selling pressure at higher prices. The resistance at $5.50, as shown on the chart, has shown itself to be a crucial area of dispute. Toncoin quickly reversed course after hitting this level, suggesting that sellers are still in control of the market at these prices.

The falling volume is one of the main causes of this abrupt change. There appeared to be little interest in follow-through buying, as Toncoin's trading volume tapered off as it approached $5.05. The price fell quickly and was sharply rejected because there was not enough volume to break through the resistance.
The next important level to keep an eye on for Toncoin is approximately $5. Whether the asset can regain its bullish momentum or if it will continue on its downward trajectory will be determined in large part by this psychological support level. A critical level that needs to be maintained below this to stop further declines is the $4.50 support level.
XRP's triangle formation
As seen on the chart, XRP is forming a key symmetrical triangle pattern, which frequently denotes a period of consolidation preceding a noteworthy price movement. An asset's lower highs and higher lows combine to form two converging trend lines, which is how this pattern forms.
Trader expectations typically include a breakout that may determine the course of the next significant price movement as the asset gets closer to the triangle's apex. For XRP in particular, the triangle formation is significant because it suggests that volatility is declining and a significant move is about to occur.

When XRP reaches the end of this pattern, let's examine two possible outcomes:
Positive Prospects: A bullish continuation could be indicated by XRP breaking out of the triangle higher, with the price likely to move toward the upper resistance levels around $0.58 and sometimes even higher. In this instance, $0.55 would be the first target, and $0.58 would be the next significant resistance level to keep an eye on. The next psychological level might be $0.60 if XRP is able to break above $0.58.
Bearish Scenario: Conversely, a bearish breakdown may be indicated if XRP is unable to maintain the triangle's lower boundary.
Under these circumstances, it is likely that XRP will retreat back toward support levels around $0.52 and then toward $0.50, which has historically served as a significant support level. The market sentiment could turn negative or the overall crypto markets could decline, which would lead to a deeper sell-off with potential downside toward the $0.48 region if the price breaks below $0.50.
 Dan Burgin
 U.Today Editorial Team