Disclaimer: The opinions expressed by our writers are their own and do not represent the views of U.Today. The financial and market information provided on U.Today is intended for informational purposes only. U.Today is not liable for any financial losses incurred while trading cryptocurrencies. Conduct your own research by contacting financial experts before making any investment decisions. We believe that all content is accurate as of the date of publication, but certain offers mentioned may no longer be available.
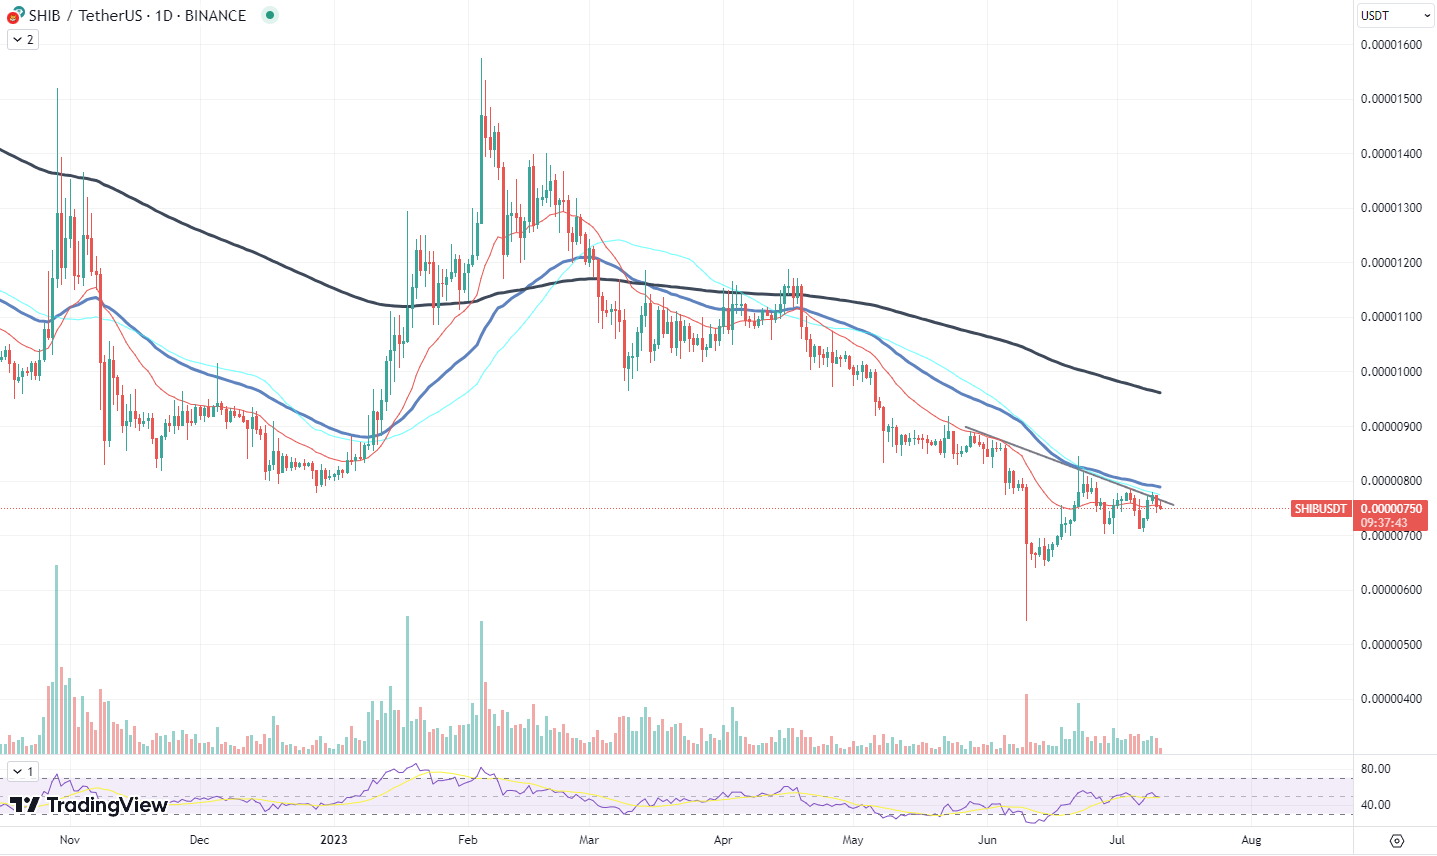
In the tug of war between bulls and bears on the cryptocurrency market, it appears that Shiba Inu (SHIB) is currently losing ground to bears. The meme token faced a setback recently as it was rejected at a crucial local resistance level and has since retraced somewhat.
After the rejection at the resistance, Shiba Inu has experienced a slight retracement. Nevertheless, it is important to note that the retrace is not yet complete, indicating that SHIB is not completely in the bears' grip just yet. The token's trading volume has remained steady, suggesting that a breakout is still a possibility. But the market is currently in a stagnation phase, which adds a layer of uncertainty to SHIB's immediate future.

The Relative Strength Index (RSI), a popular momentum indicator, currently sits in a neutral zone for Shiba Inu. This suggests that the asset is neither overbought nor oversold at the moment, hinting at a lack of clear direction from market participants.
Ethereum can still rally
Ethereum (ETH), the second largest cryptocurrency by market cap, might be ready to embark on another upward journey. Recent market dynamics suggest that Ethereum's current position could be paving the way for a new leg up, despite the recent period of consolidation.
A crucial factor supporting the bullish scenario for Ethereum is the asset's overall uptrend. Following the market-wide crash in May, Ethereum, like many other cryptocurrencies, has been on a recovery path. The cryptocurrency has been marking higher lows, an indication that buyers are stepping in at progressively higher prices, signaling strong demand.
Another significant development is the possibility of a volatility squeeze. Ethereum's trading volume has been on a decline recently, implying that market participants are adopting a wait-and-see approach. This pattern often leads to a significant movement in price, also known as a volatility squeeze, as the market suddenly shifts from a period of low volatility to high volatility.
A declining trading volume, combined with Ethereum's ongoing uptrend, could potentially trigger a positive volatility squeeze, pushing ETH prices higher. Market participants should, however, be aware that this scenario hinges on Ethereum maintaining its current uptrend and market sentiment remaining positive. A shift in either of these factors could alter the trajectory.
Polygon among winners
In a market where almost every asset has been trading sideways or losing value, Polygon (MATIC) has displayed impressive resilience. The native token of the Ethereum scaling solution has recently broken above its 50 Exponential Moving Average (EMA), a bullish signal that could potentially indicate the beginning of a new upward trend.
The 50 EMA is a widely followed technical analysis indicator used to gauge medium-term trend directions. A breakthrough above this line is often seen as a sign of bullish strength and could attract additional buying interest. In the case of MATIC, this recent movement above the 50 EMA is encouraging and could set the stage for further price appreciation.
Additionally, Polygon's Relative Strength Index (RSI) has risen above 50, adding to the optimistic outlook. The RSI is a momentum oscillator that measures the speed and change of price movements. An RSI value above 50 typically suggests that an asset is in a bullish phase, while a value below 50 indicates bearish momentum.
Despite these promising signs, caution is advised. MATIC's price has only broken above the 50 EMA by a slim margin of about 2%. Given this narrow lead, there is a risk of a potential downward reversal. Investors should closely monitor this situation, as a fall below the 50 EMA could quickly change the short-term outlook from bullish to bearish.


 Dan Burgin
 Alex Dovbnya
 Denys Serhiichuk
 Caroline Amosun