Disclaimer: The opinions expressed by our writers are their own and do not represent the views of U.Today. The financial and market information provided on U.Today is intended for informational purposes only. U.Today is not liable for any financial losses incurred while trading cryptocurrencies. Conduct your own research by contacting financial experts before making any investment decisions. We believe that all content is accurate as of the date of publication, but certain offers mentioned may no longer be available.
XRP seems to be caught in a tight spot. Over the past week, its price has been oscillating between the 200 exponential moving average (EMA) and a lower price channel support. This lower support has historically acted as a robust cushion for XRP, preventing any drastic downward spirals.
In the last seven days, XRP's price has seen subtle fluctuations. Starting from Sept. 17, the price was at $0.499, and it experienced minor ups and downs throughout the week. By Sept. 23, the price slightly increased to $0.508. While these movements might seem insignificant at first glance, they indicate a period of consolidation and potential buildup for a more substantial move.
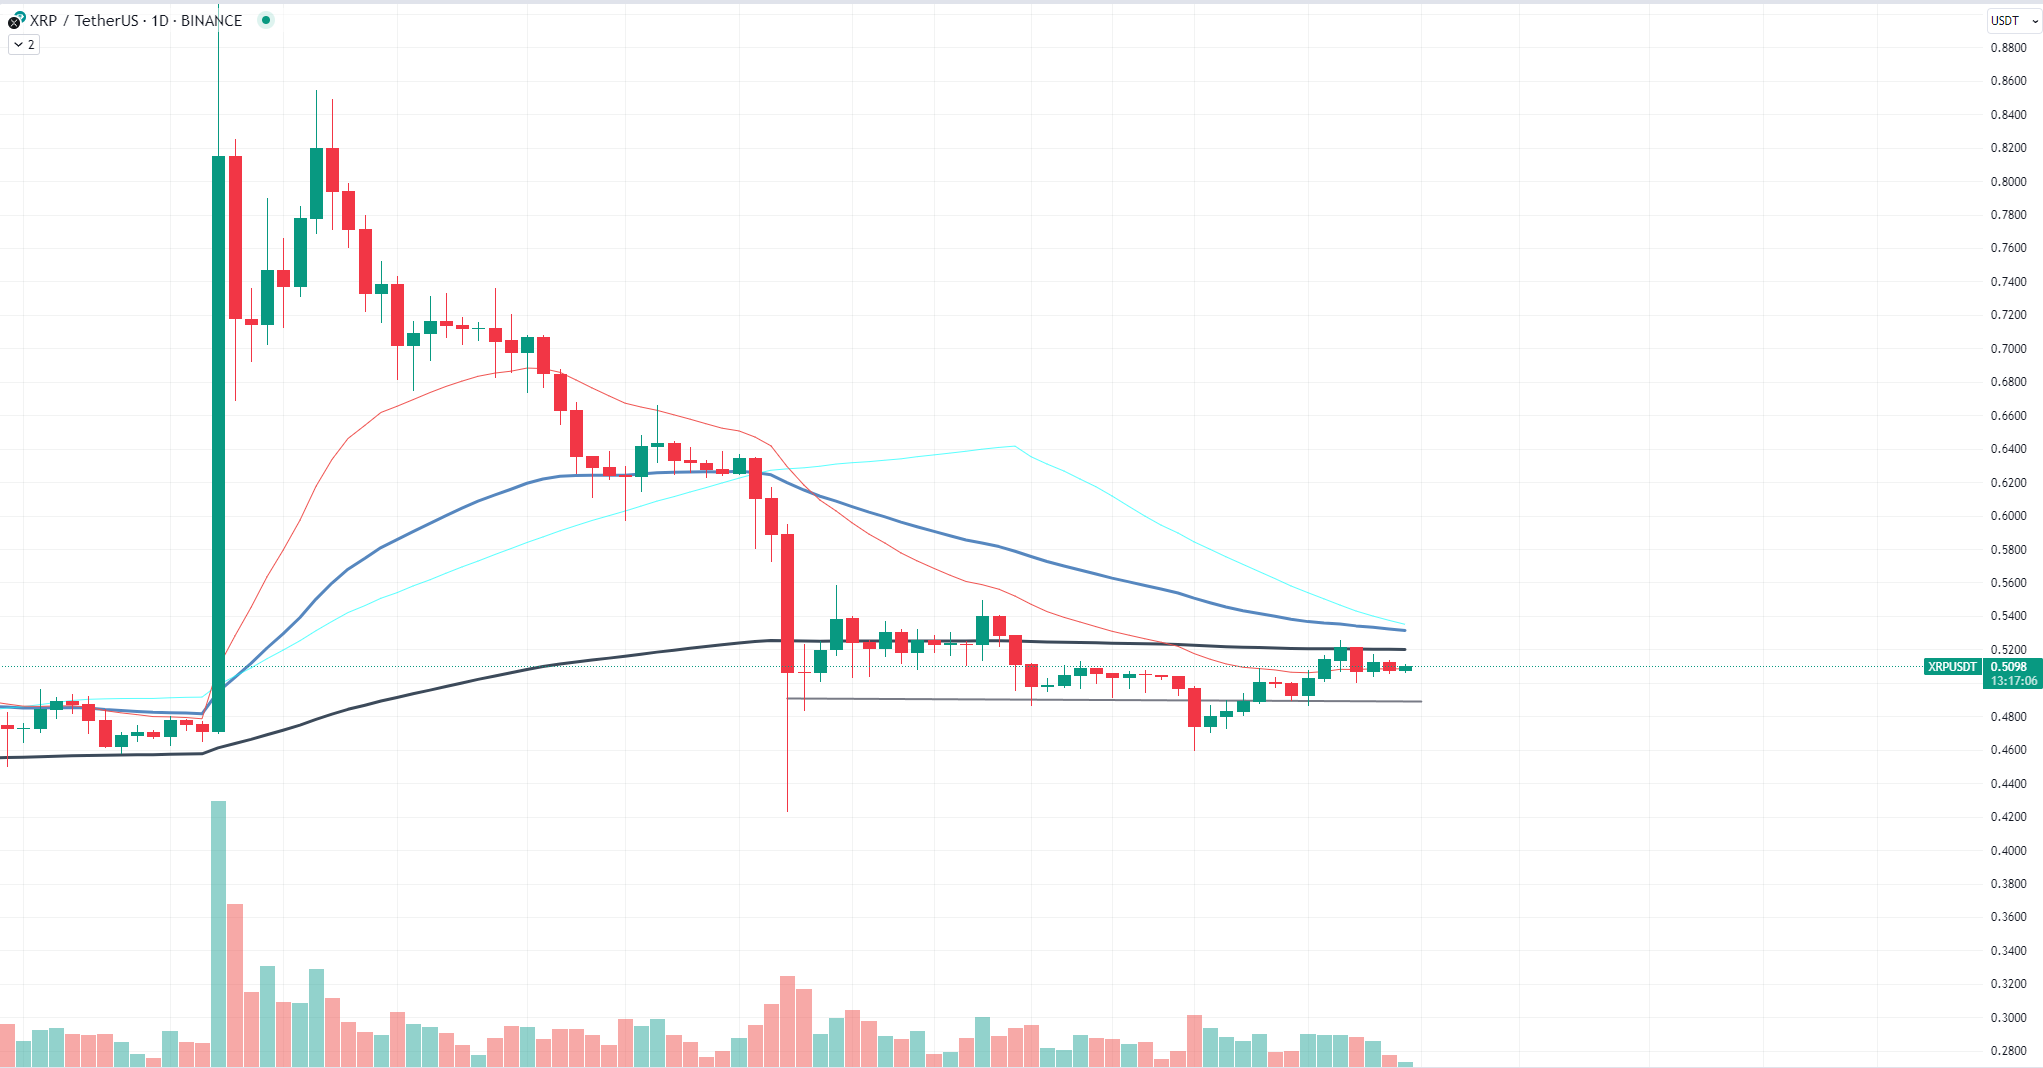
One of the intriguing aspects of XRP's current price behavior is the convergence of moving averages. When moving averages come closer together, it often hints at a potential surge in volatility. In layman's terms, XRP might be gearing up for a significant price move, be it upward or downward. The convergence of these averages can act as a pressure cooker, with the price of XRP being the steam looking for an outlet.
Shiba Inu got rejected
Shiba Inu, the meme coin that took the crypto world by storm, faced a harsh rejection at a local resistance level, hovering around $0.00000773. This rejection has raised eyebrows and sparked discussions among traders and investors alike.
Over the past week, Shiba Inu's price has seen some fluctuations. Starting the week at approximately $0.00000740, it experienced a slight dip before making an attempt to break past the resistance. The highest it reached was around $0.00000750, but it could not sustain the momentum and fell back to its current level of approximately $0.00000730. These numbers might seem minuscule, but for a token with such a vast circulating supply, even tiny price movements can translate to significant market cap changes.

The broader cryptocurrency market has been characterized by low volatility recently, with many assets moving sluggishly. In such an environment, Shiba Inu's movement stands out. Despite the prevailing market sentiment and the recent rejection, Shiba Inu has been tracing an ascending trend. This trend suggests that there is underlying strength and support for the token, even when faced with resistance.
It is essential to note that moving averages are inching closer together, hinting at a potential surge in volatility soon. For traders, this could mean opportunities for both long and short positions, depending on how the price reacts to the upcoming volatility.
While Shiba Inu started as a meme coin, its community has been working tirelessly to add utility and value to the token. The recent price movements, coupled with its ongoing projects, make it a token to watch closely.
Ethereum fails to break through
Ethereum (ETH), the second-largest cryptocurrency by market capitalization, has recently experienced a notable price movement. On Sept. 20, Ethereum attempted a breakthrough but was met with a swift reversal. This event has left many in the crypto community pondering the future trajectory of the asset.
Over the past week, Ethereum's price has shown some fluctuations. Starting from Sept. 13, ETH was priced at approximately $1,593. As the days progressed, it reached a peak of around $1,658 on Sept. 18. However, by Sept. 20, the price had slightly decreased to approximately $1,643. This movement indicates a failed attempt to sustain higher price levels, especially given the broader context of the market's low volatility.

One of the significant factors to consider is the volume reversal that occurred after the failed breakthrough. A volume reversal, especially after a price spike, can be an indication of a change in market sentiment. In Ethereum's case, it could mean that traders and investors were quick to take profits, anticipating a potential downturn or simply reallocating their portfolios in response to other market signals.
Despite the recent challenges, it is essential to note that Ethereum has been on an ascending trend. The network's continuous development, coupled with its dominant position in the DeFi and NFT sectors, provides a strong foundation for future growth. However, the current market conditions, characterized by low volatility and anemic movement across most assets, can influence Ethereum's short-term price action.
 Dan Burgin
 U.Today Editorial Team