
Disclaimer: The opinions expressed by our writers are their own and do not represent the views of U.Today. The financial and market information provided on U.Today is intended for informational purposes only. U.Today is not liable for any financial losses incurred while trading cryptocurrencies. Conduct your own research by contacting financial experts before making any investment decisions. We believe that all content is accurate as of the date of publication, but certain offers mentioned may no longer be available.
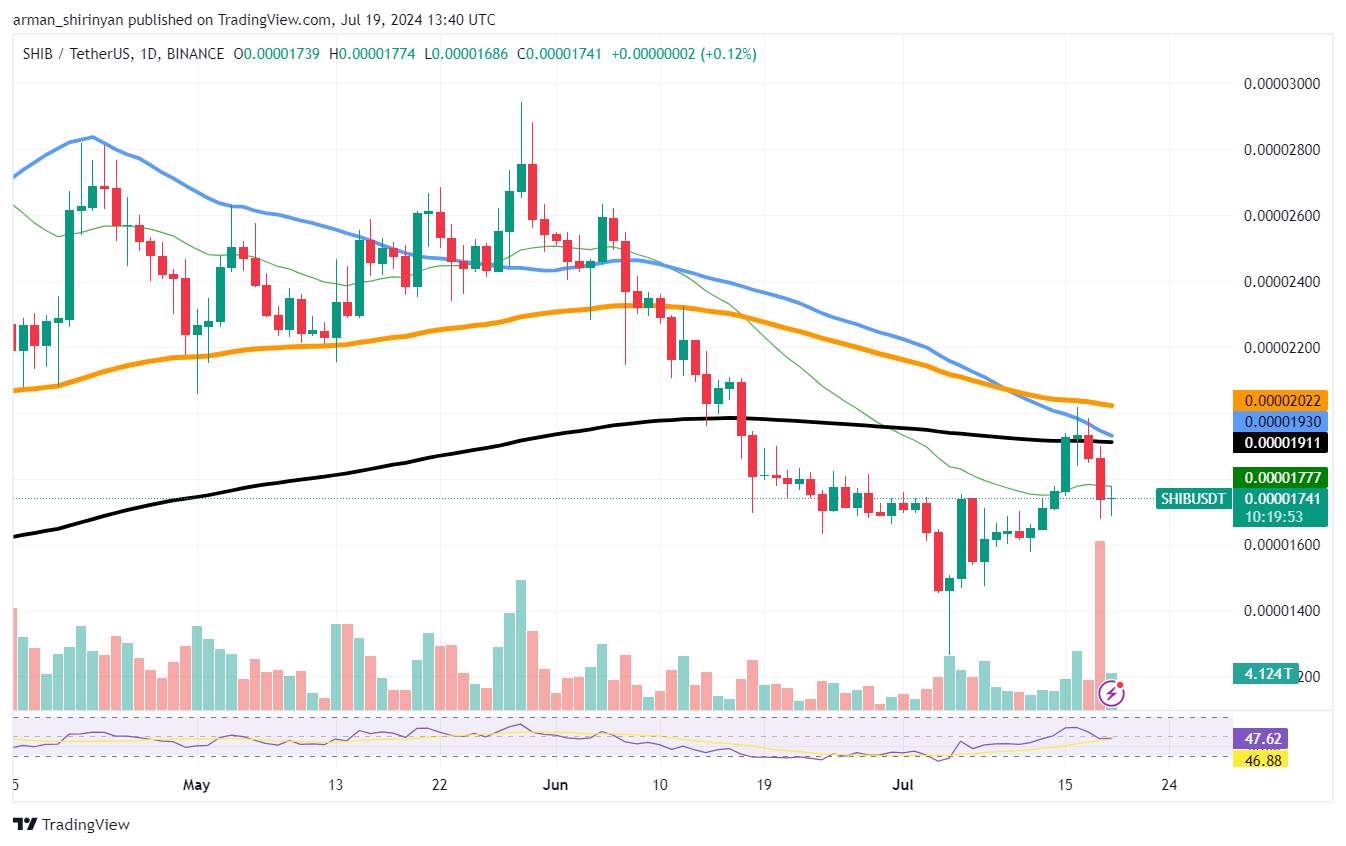
Despite the major surge of selling pressure, Shiba Inu avoided the drop pretty easily, securing the $0.000017 threshold and avoiding a substantial price correction. However, the general sentiment on the market might push SHIB's value down.
Shiba Inu was able to maintain its position at the $0.000017 level recently. This resilience is remarkable in light of recent market activity, which included a high volume of transactions that put the network's capacity to the test.
The WazirX exchange hack, which led to the loss of trillions of SHIB tokens that are currently in circulation on the market, was connected to the unanticipated spike in transactions. WazirX had about $230 million in assets stolen, including 5.43 trillion SHIB tokens and other significant cryptocurrencies like ETH and MATIC, according to an update following the incident.
The stolen SHIB was promptly sold for 26,535 ETH, or about $92 million, by the hacker, who went by the name WazirX Exploiter. Although there was a large increase in liquidity due to the unexpected inflow of SHIB tokens, the price of SHIB managed to absorb the impact rather well.
By purchasing SHIB from decentralized exchanges and depositing it to centralized exchanges for arbitrage, market makers like Wintermute considerably contributed to the stabilization of the market. This action lessened the possibility of a price decline, highlighting the robustness and durability of SHIB's market structure.
Solana's performance recovery
Solana has been showing one of the strongest performances on the market in the last few days and might easily gain even more momentum. These price levels are crucial for the future of the asset, and here they are.
The 100 EMA level of $147 represents a key support level for Solana. If this level is held above, it can serve as a springboard for additional gains and a sign of solid buying interest. Solana has recovered from this level in recent sessions, demonstrating resistance to sell-offs on the broader market.

Solana has the potential to reinforce investor confidence and open the door for higher price targets if it can sustain this support. The next level that Solana is attempting to test is the $165 mark, which is a recent resistance.
The current bullish trend may continue if this level is convincingly broken through. Increased buyer interest would probably drive up the price. This stage is critical because it could decide whether Solana can keep moving forward or experience a brief setback.
The last level to keep an eye on is $185, a crucial resistance level that Solana has previously found difficult to overcome. If this level is broken, it may lead to new highs and draw a lot of institutional attention. As traders and investors try to ride the momentum, a breakout above this psychological barrier may result in faster gains.
Bitcoin's hidden pattern
The cup and handle pattern is usually an easy to spot pattern; however, its inclined version might be a tricky thing to spot. In the case of Bitcoin, it could be the case. If the pattern plays out successfully, BTC might surge to values much higher.
Usually indicating a period of consolidation followed by a breakout, the cup and handle pattern is a bullish continuation pattern. A gradual rising trend, a rounded bottom and a rise back to the previous high combine to form the cup, which takes the shape of a U. The handle is characterized by a brief period of consolidation or a small downward drift, followed by a breakout to all-time highs.

An inclined version of this pattern can be seen on the current Bitcoin chart. Potentially forming the cup, the recent upward trend has created a rounded bottom. Should Bitcoin persist in its consolidation and form the handle, a significant breakout may ensue. Since it denotes the upper boundary of the cup, the $66,000 level is significant.
A break above this mark would indicate a significant bullish move and validate the cup and handle pattern. The $58,000 mark represents a strong support area on the downside. In order to preserve the integrity of the cup formation, this level must be maintained. If the pattern materializes, as anticipated, Bitcoin may rise as high as $70,000. The depth of the cup added to the breakout point yields this target.
 Dan Burgin