
Disclaimer: The opinions expressed by our writers are their own and do not represent the views of U.Today. The financial and market information provided on U.Today is intended for informational purposes only. U.Today is not liable for any financial losses incurred while trading cryptocurrencies. Conduct your own research by contacting financial experts before making any investment decisions. We believe that all content is accurate as of the date of publication, but certain offers mentioned may no longer be available.
Bonk has seen a precipitous decline in its market value, evidenced by the recent price chart that indicates a loss of nearly 50% from its peak. This dramatic downturn highlights the risks inherent in investing in highly volatile digital assets, particularly those like BONK, which may be influenced by their novelty or "meme" status rather than underlying fundamentals.
The chart analysis of BONK's price action reveals a steep ascent followed by a sharp decline, a pattern reminiscent of other meme coins, such as Shiba Inu. These types of cryptocurrencies often attract attention and investment due to social media hype and speculative trading, resulting in rapid price increases.
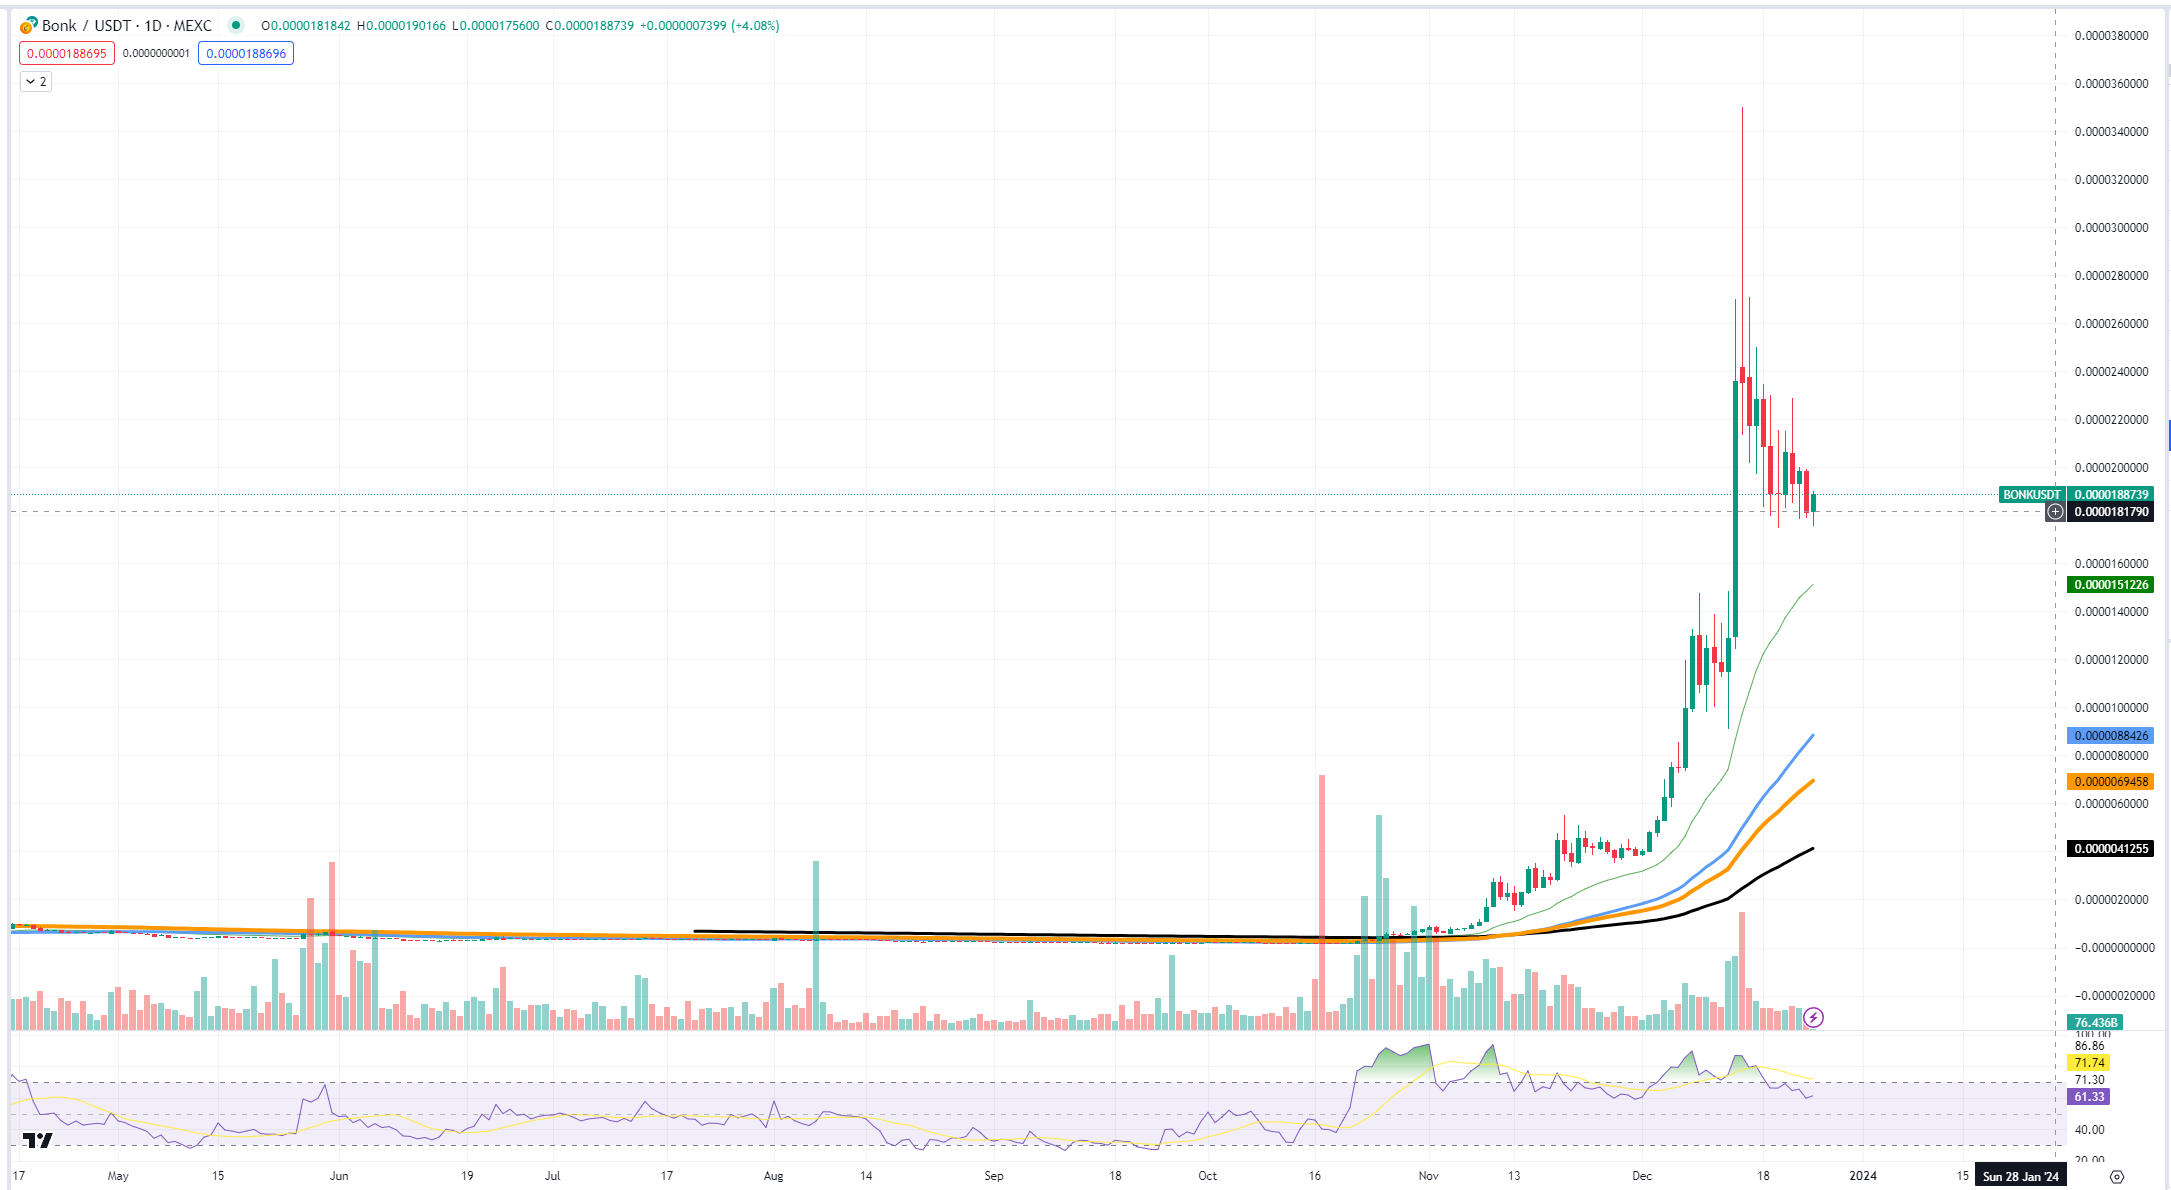
However, without substantial technological or economic underpinnings, they tend to suffer equally rapid declines, leaving investors facing significant losses.
For those who have engaged in leveraged investments, the drop in BONK's value is especially troubling. Leverage can amplify gains during market upswings but can result in magnified losses when the price falls. The halving of BONK's value is a stark reminder of the perils of leveraging on the volatile cryptocurrency market, where the line between profit and loss can be alarmingly thin.
BONK's trajectory parallels that of Shiba Inu, which experienced an explosive entry onto the cryptocurrency scene, capturing the imagination and wallets of investors looking for the next big win. Yet, as the initial excitement waned, the price struggled to maintain its meteoric heights, leading to substantial pullbacks.
Pivotal moment for Doge
As Dogecoin encounters a pivotal support level, a trend reversal looms on the horizon and creates a possibility for investors. Notably, legacy meme coins like DOGE often exhibit reversals at the final stages of extremely volatile markets, signaling an inflection point. The current chart demonstrates DOGE approaching the 26-day exponential moving average.
The 26-day EMA is predominantly utilized in stock market analysis, providing a dynamic level of support or resistance based on the average closing prices of the past 26 days, weighted to favor more recent price action. Despite its roots in equities, its application to the Dogecoin chart appears valid.

The reasoning behind this is that while cryptocurrencies are known for their volatility, they still adhere to some of the fundamental principles of technical analysis. The EMA serves as a smoother and more responsive version of the simple moving average, making it particularly suitable for the fast-moving crypto market.
In the current scenario, Dogecoin's approach to the 26-day EMA coincides with a reduction in trading volume, as indicated by the volume bars beneath the price chart. This convergence could be indicative of a consolidation phase, often a precursor to a significant price movement. A declining volume suggests reduced selling pressure, which, when coupled with the support level provided by the EMA, raises the potential for a bullish reversal.
End for Solana?
The Solana (SOL) price chart is exhibiting potential early signs of a reversal, which may suggest an impending correction phase. A recent candlestick formation on the chart displays characteristics commonly associated with trend exhaustion, which can often precede a shift in market sentiment.
Upon closer examination of the chart, a distinct candle with a long upper shadow can be identified, indicating that while buyers pushed the price higher within the period, there was a significant sell-off that brought the price down from its highs. Such price action typically reflects uncertainty on the market and can be an early warning sign of a changing tide, especially after a strong uptrend.

The technical indicators further buttress the notion of an overextension in Solana's recent price surge. The Relative Strength Index has ventured into overbought territory, a level above 70, for an extended period. Historically, such elevated RSI readings suggest the asset may be due for a retracement.
From a market capitalization perspective, Solana's rapid appreciation to a valuation of 48 billion USD positions it as the third-largest cryptocurrency by market cap. This substantial growth brings into question the sustainability of its rally from both the technical and financial viewpoints.
Investors and traders should be aware that the first signs of a potential reversal, coupled with extremely overbought status, may indicate that a period of price consolidation or correction could be on the horizon for Solana.
 Dan Burgin
 U.Today Editorial Team