Disclaimer: The opinions expressed by our writers are their own and do not represent the views of U.Today. The financial and market information provided on U.Today is intended for informational purposes only. U.Today is not liable for any financial losses incurred while trading cryptocurrencies. Conduct your own research by contacting financial experts before making any investment decisions. We believe that all content is accurate as of the date of publication, but certain offers mentioned may no longer be available.
Ethereum has wiped out the gains it had accumulated over a sustained period. The ETH/USD price chart depicts a grim narrative as the digital asset has swiftly descended from its peak, retracing back to levels that question the sustainability of its prior growth.
The steep decline in Ethereum's price is a significant bearish signal. It reflects the market's hesitancy to invest at previous highs, most likely due to the underperformance Ethereum has shown in the recent past. This lack of traction and inability to initiate a recovery underscores the vulnerability of Ethereum's price in the current market climate.
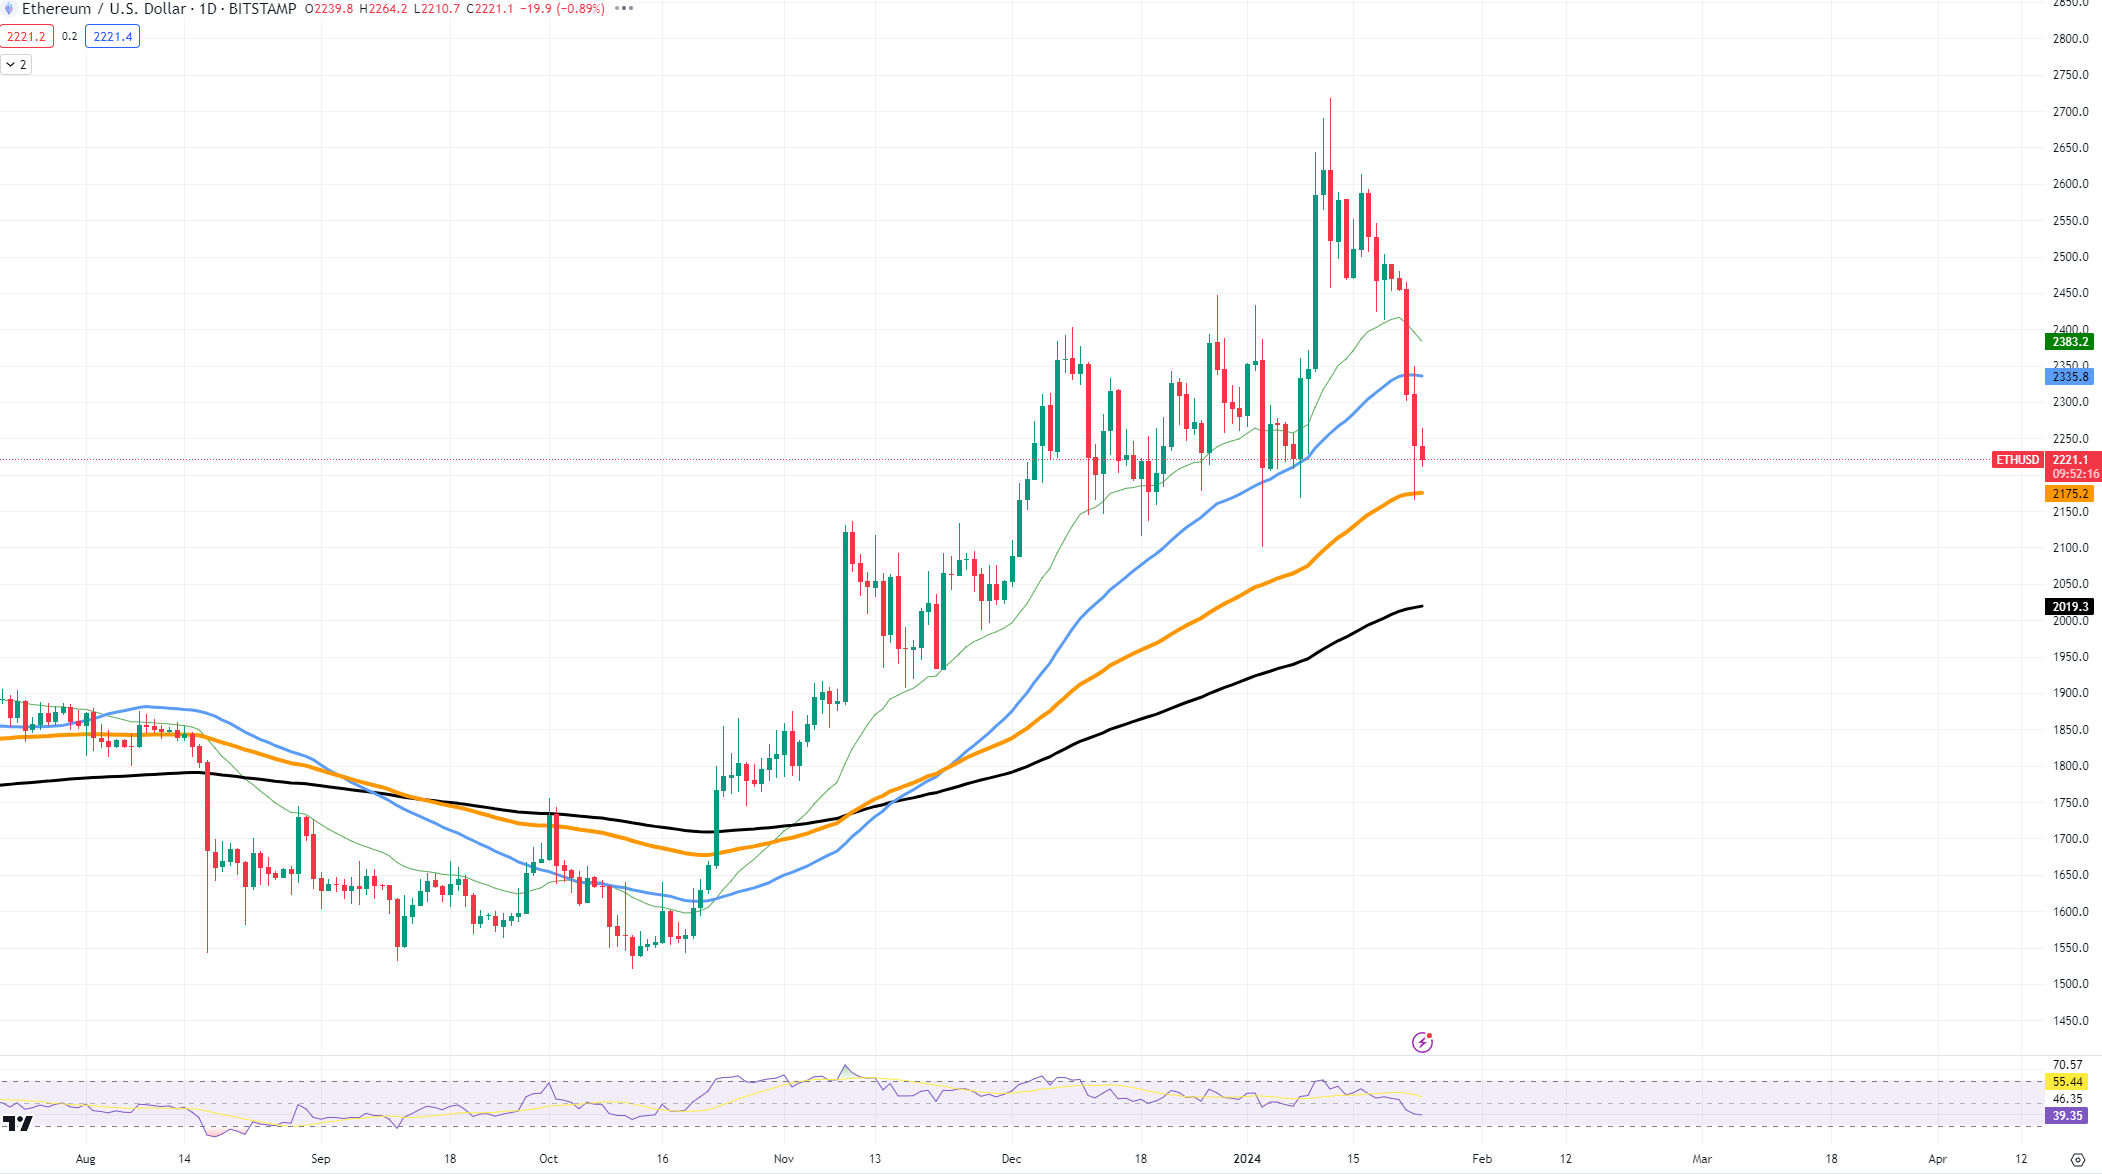
Focusing on the technical aspects, Ethereum has broken through what was once seen as a strong support level at approximately $2,350. This price point, which previously saw substantial buying interest, has now been breached, leading to a cascading effect as the asset searches for new support. The next critical support level is around $2,175, where buyers might emerge to stall the downfall.

Conversely, any attempts at recovery will first encounter resistance at around $2,338, a level that now marks the lower boundary of what was a consolidation range before the drop. A close above this level on significant volume could signal a temporary respite from selling pressure. However, the real test lies at higher resistance levels, previously established around $2,500, where ETH struggled to maintain upward momentum.
Bitcoin ready to fight
Recent candlestick formations portray a scenario where Bitcoin is flirting with a critical resistance level, poised to either confirm a bearish trend or start a substantial recovery.
The chart illustrates Bitcoin’s recent descent, as it lost its foothold at the higher price echelons it previously occupied. However, amid this downward movement, Bitcoin is showing signs of resilience. The latest candles indicate a potential reversal as they hover around a significant support level, which can be identified at approximately $37,000, a region where buyers have historically stepped in.

A sustained hold above this point could catalyze renewed buying interest, which may drive the price toward the immediate resistance level at around $41,000. The significance of reclaiming this threshold cannot be understated, as it may invalidate the bearish outlook and signal a trend reversal.
As for the upper resistances, the $43,000 and $46,000 price levels stand out as notable barriers that Bitcoin would need to breach to cement a robust recovery narrative. Achieving such milestones could sway market sentiment positively, potentially ushering in a wave of optimism among investors.
The moving averages offer additional insight, suggesting a possible bullish crossover should the current momentum persist. This scenario would be further supported by a rise in trading volume, which typically accompanies decisive trend shifts.
Solana among leaders
Solana shows signs of a nascent comeback, presenting a bullish scenario amid a broader market recovery. However, investors tread cautiously, aware of the potential of a "dead cat bounce" since volume profiles signal restraint.
Analyzing the SOL/USDT chart, we notice that Solana has established a local support level around the $70 price mark. This is characterized by multiple touches of this level over the past few weeks, each time resisting further downward movement.

On the flip side, the local resistance can be identified near the $96 level, which previously acted as support during Solana's consistent upward trend.
The price movement is currently sandwiched between the 50-day moving average acting as dynamic resistance and the 200-day moving average serving as potential dynamic support. The narrowing gap between these averages could squeeze the price action, possibly leading to a volatility breakout.
 Dan Burgin
 U.Today Editorial Team