
Disclaimer: The opinions expressed by our writers are their own and do not represent the views of U.Today. The financial and market information provided on U.Today is intended for informational purposes only. U.Today is not liable for any financial losses incurred while trading cryptocurrencies. Conduct your own research by contacting financial experts before making any investment decisions. We believe that all content is accurate as of the date of publication, but certain offers mentioned may no longer be available.
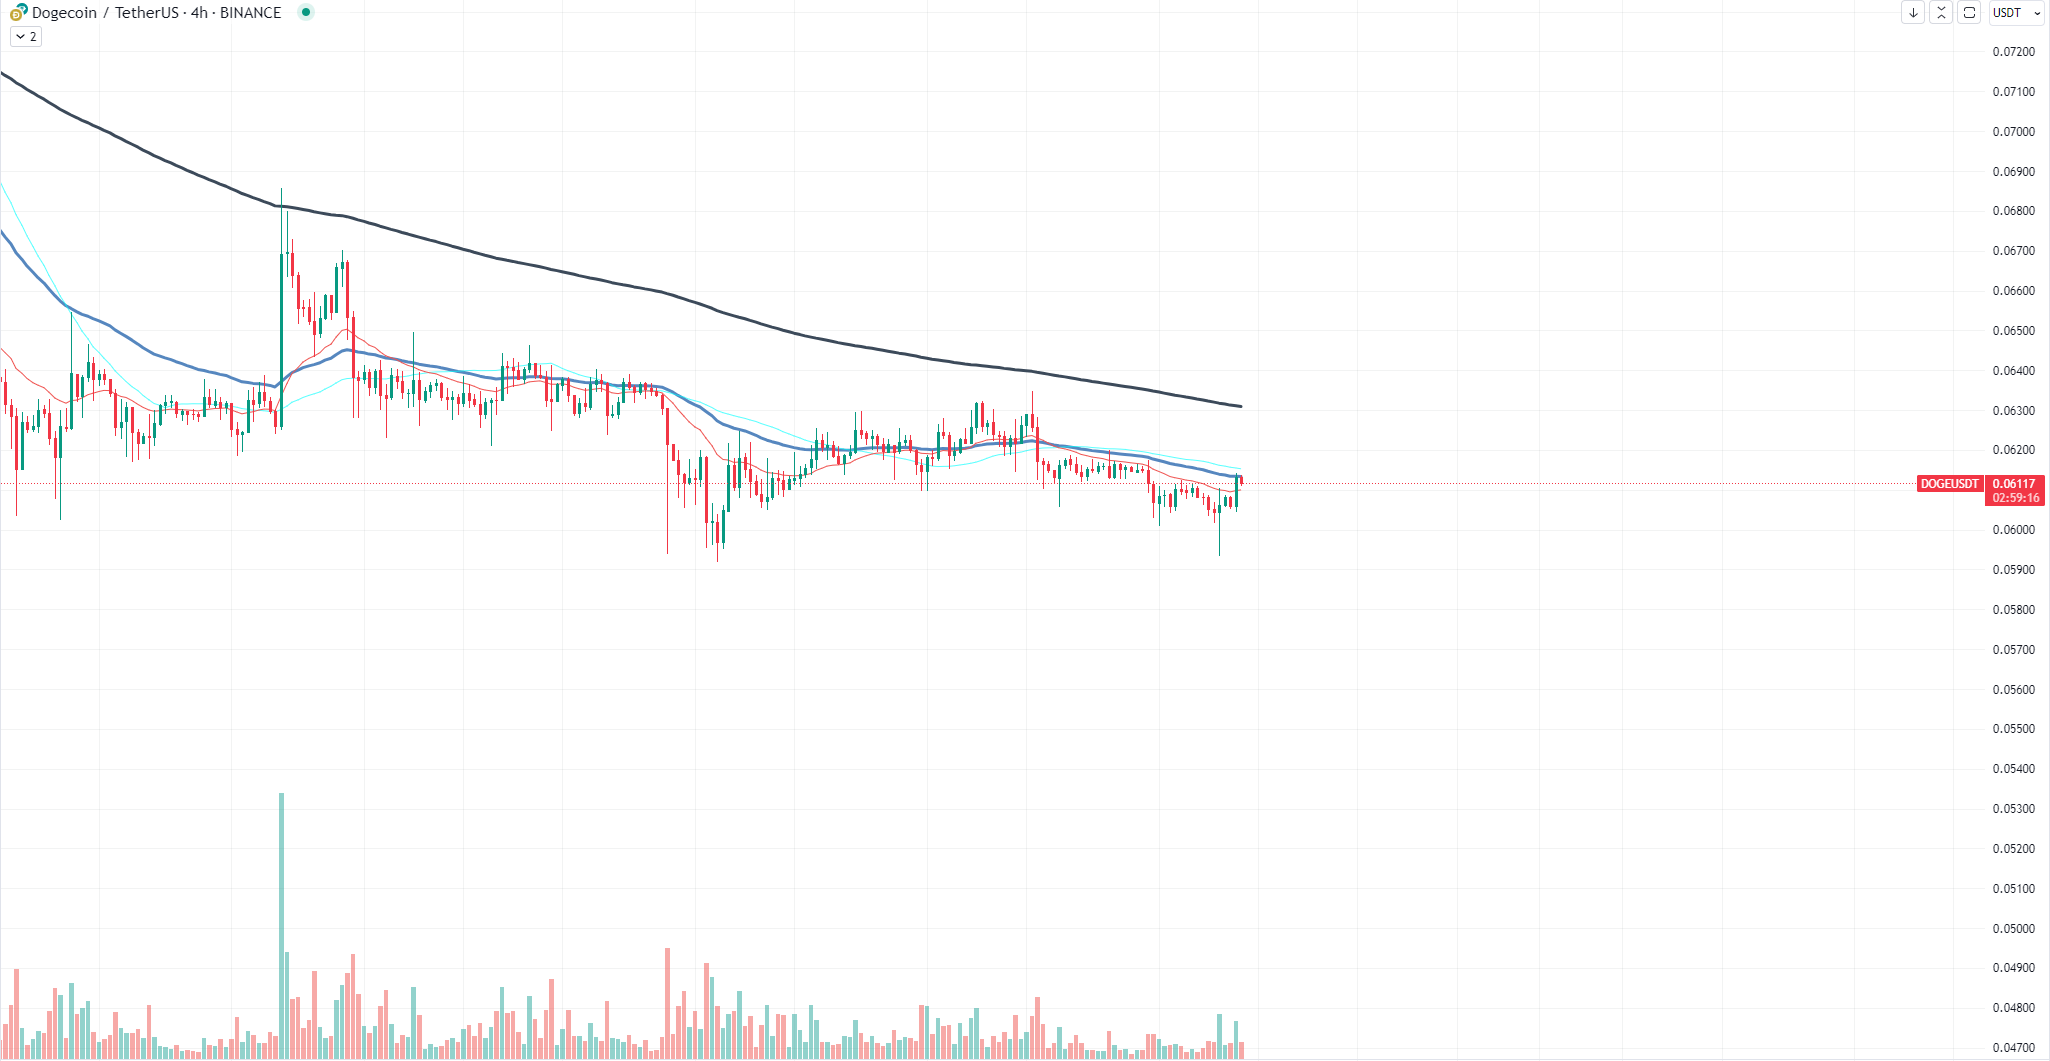
Dogecoin (DOGE) has been dancing around a critical price point that has served as a robust support level since Aug. 18. Currently, the asset is priced at approximately $0.0605, according to the most recent data. This level has been a sanctuary for DOGE, successfully bouncing off it four times. Now, the asset is poised for a fifth bounce, and the crypto community is watching closely.
The $0.06 price level is more than just a number; it is a psychological threshold for investors and traders alike. Each time DOGE has dipped to this level, it has managed to rebound, instilling a sense of reliability around this price point. The question now is, can it hold for the fifth time?
Recent data shows consistent trading volume and network activity for Dogecoin, which could be indicative of a strong support level. The asset's ability to maintain this price level could serve as a catalyst for future price movements, either propelling it to new heights or confirming its stability.
However, it is essential to note that the crypto market is highly volatile, and while past performance can be indicative, it is not a guarantee of future results. Therefore, investors should exercise caution and conduct their own due diligence before making any investment decisions.
Harbinger of volatility
As of the latest data, Ethereum is trading at approximately $1,591.46, while Bitcoin stands at $26,227. This shift in the ETHBTC pair is more than just a market quirk — it serves as a volatility indicator, signaling broader market trends.
The ETHBTC pair is often viewed as a barometer for the crypto market's volatility. When Ethereum gains against Bitcoin, it is usually a sign that alternative assets and decentralized finance (DeFi) platforms are experiencing growth. This, in turn, often leads to increased market volatility as traders and investors shift their focus and resources.

Why is this pair a volatility indicator? Simply put, Bitcoin is the original cryptocurrency, the "gold standard," if you will. When other assets, particularly Ethereum, start to gain against Bitcoin, it indicates a diversification of interest and investment. This diversification is often a precursor to higher volatility as it shows that the market is not just Bitcoin-centric anymore. The rise of DeFi platforms, most of which are built on the Ethereum blockchain, adds another layer to this narrative.
The recent uptick in Ethereum's price against Bitcoin suggests that we might be entering a phase of increased market volatility. It is a sign that traders and investors are looking beyond Bitcoin, exploring alternative assets that offer different kinds of value and utility. This is particularly important for Ethereum, which is at the heart of the booming DeFi sector.
Shiba Inu stumbles
Shiba Inu, the meme coin that took the crypto world by storm, is now facing a critical juncture. The asset has recently dipped below the lower boundary of its ascending price trend, a move that could potentially accelerate its overall decline. As of the latest data, SHIB is trading at approximately $0.00000722, a concerning figure for investors who have been riding its uptrend.
The descending shift in Shiba Inu's price is not an isolated event; it is part of a broader pattern. Network activity and trading volume for SHIB have been on a downward trajectory, signaling waning interest or perhaps a consolidation phase before another price action. Either way, the asset's inability to maintain above this crucial threshold is a red flag for short-term bullish prospects.
Analyzing the price dynamics, it is evident that Shiba Inu is struggling to find solid footing. The asset's fall below the lower border of its ascending trend could act as a catalyst for further depreciation. This is a classic case where breaking a key support level can trigger a cascade of sell orders, pushing the price even lower.
The situation is further exacerbated by decreasing network activity. A vibrant network is often a sign of an asset's health and potential for growth. In contrast, declining network activity usually indicates reduced investor interest, which can be a precursor to a price drop.
 Dan Burgin