
Disclaimer: The opinions expressed by our writers are their own and do not represent the views of U.Today. The financial and market information provided on U.Today is intended for informational purposes only. U.Today is not liable for any financial losses incurred while trading cryptocurrencies. Conduct your own research by contacting financial experts before making any investment decisions. We believe that all content is accurate as of the date of publication, but certain offers mentioned may no longer be available.
The market's favorite meme cryptocurrency, Dogecoin, is giving off signals that could indicate where it is headed next. Recently, the asset has shown a descending volume trend, often seen as a warning sign of potential price decline.
Examining the current price chart, we can identify the local support level for DOGE at around $0.1048, a point where the price has previously stabilized before rebounding. On the upside, there is a clear resistance level at approximately $0.1439, which has been tested but has not convincingly broken through in recent trading sessions.
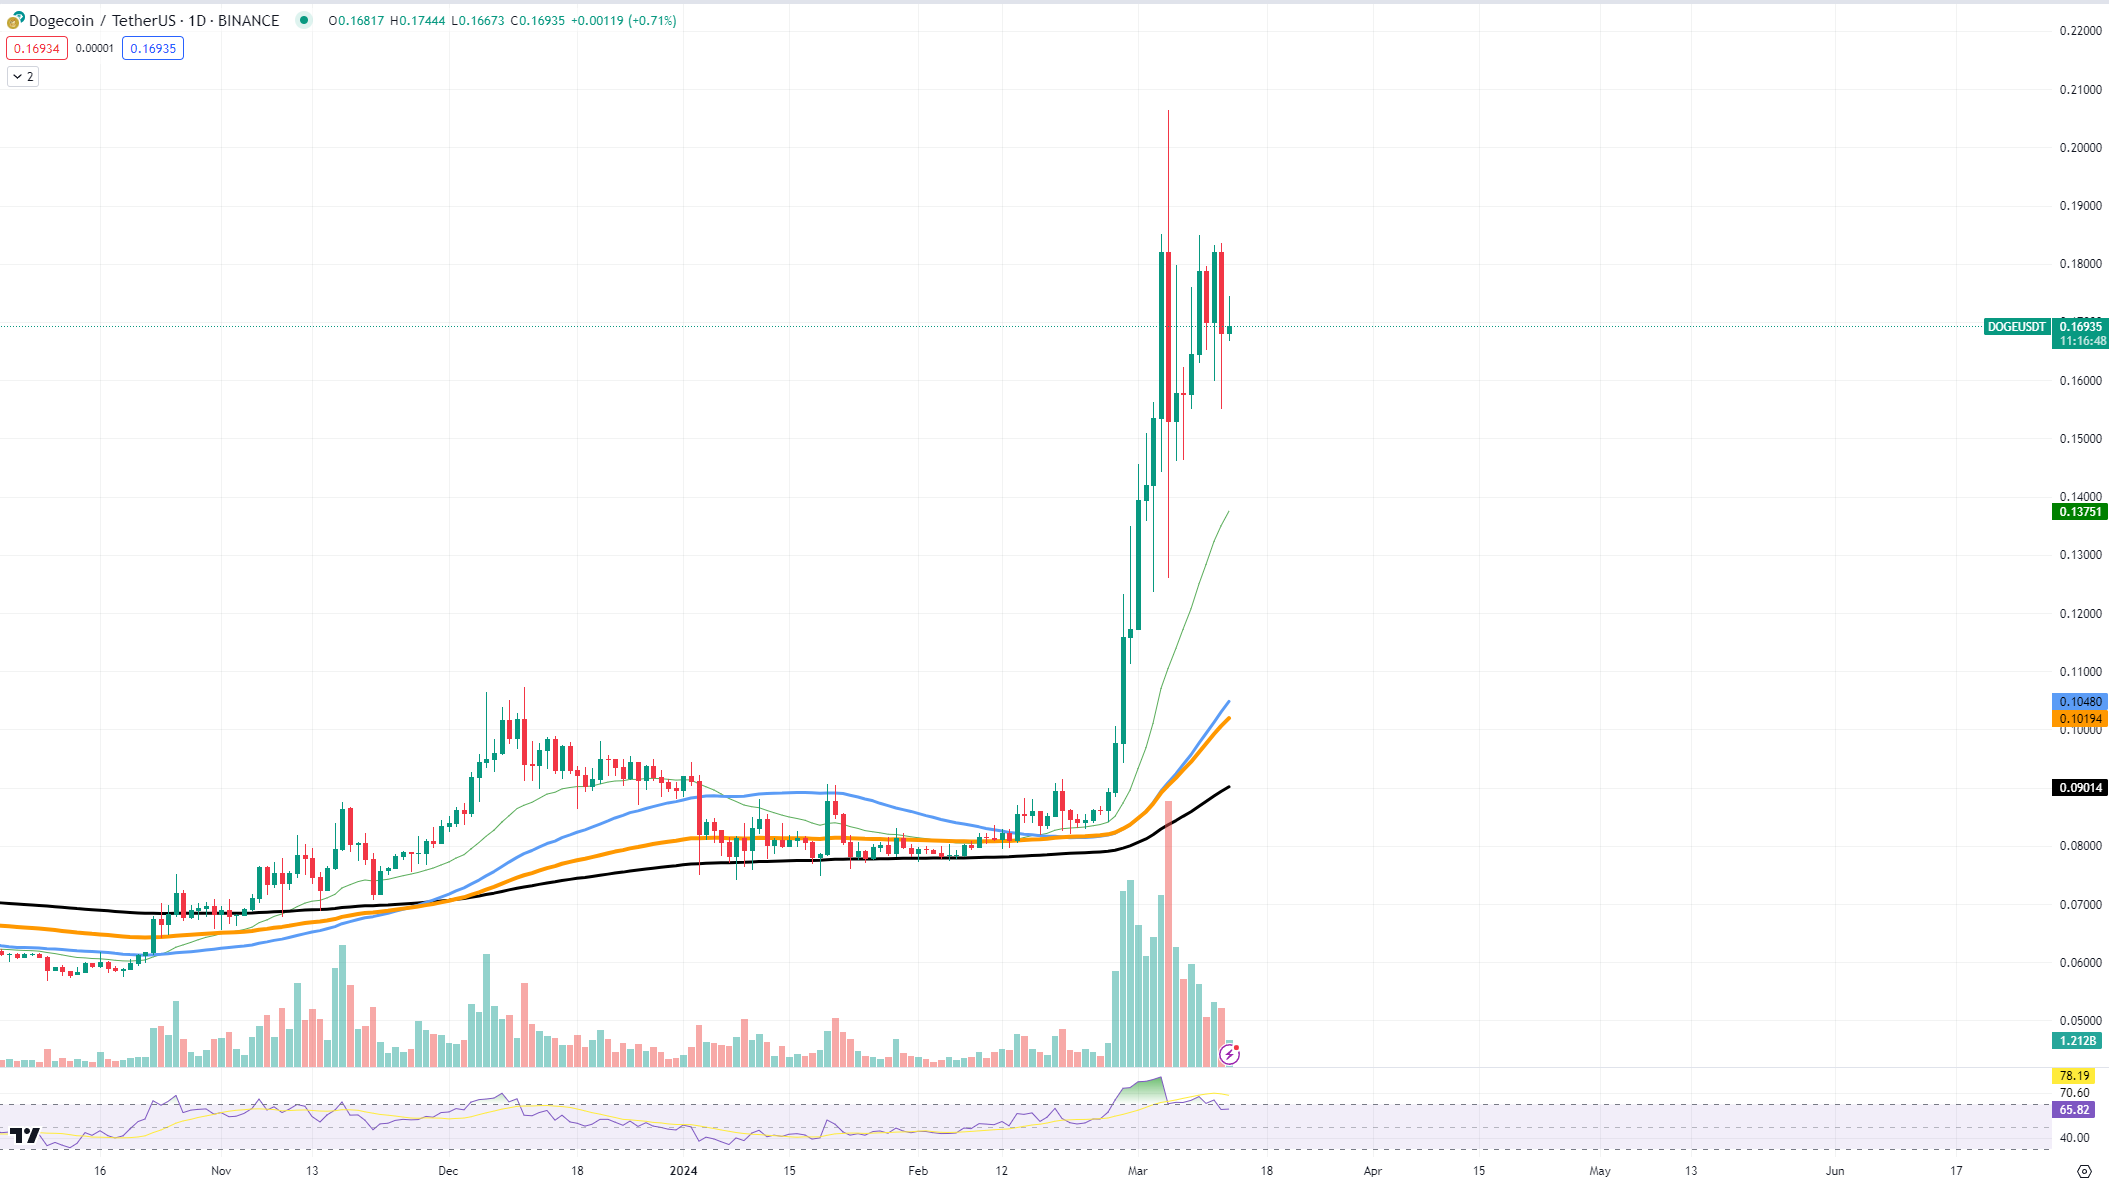
The declining volume trend coincides with a stabilization in price following a significant surge. This pattern suggests that while the interest in buying DOGE at higher prices wanes, the market is losing the momentum needed to sustain upward movement.
This does not necessarily guarantee a drop, as other market factors could come into play to revitalize buyer interest. However, should DOGE break below the current support with continued low volume, it might validate a bearish outlook, setting the stage for further declines.
Cardano faces issues
Cardano is exhibiting patterns that have raised eyebrows in the trading community. A closer look at the charts suggests a formation resembling a double top pattern. This pattern, a bearish technical reversal pattern, emerges after an asset reaches a high price two consecutive times with a moderate decline between the two highs.
It is visually identified by two peaks at approximately the same price level and is often followed by a drop in value, indicating that the asset is facing resistance at this high point and may not be able to push through.

Analyzing ADA's recent chart, the token shows two distinct peaks, indicating strong resistance at that level. The first top seems to have been met with a sell-off that brought prices down, only for them to rise back up to a similar level — forming the second top.
The support level for ADA is currently spotted at around $0.580, marked by previous consolidations. If the double top pattern holds true, we may see the price drop toward this support level.
The resistance, coinciding with the peaks of the double top, hovers around the $0.738 mark. A breakout above this level would invalidate the double top scenario, potentially leading to a bullish continuation.
Shiba Inu enters correction
The market has been keenly observing Shiba Inu, as the asset has recently shown signs of a price correction. The much-talked-about cryptocurrency, which has enjoyed substantial growth, is now facing the reality of market mechanics with a potential reversal on the horizon.
The current price chart indicates that SHIB has encountered resistance at the $0.00003888 level, where the upward momentum has begun to falter. This resistance mark is critical as it has been tested several times, with the asset struggling to maintain a stable ascent beyond this point.

On the downside, the support levels are now in sharp focus. The first notable support lies around the $0.00003286 mark, which could play a vital role if a downtrend continues. A break below this level might trigger a further sell-off, potentially leading SHIB to test the next support level near $0.00002920.
One of the telling signs of the beginning of a correction phase is the increasing selling pressure, alongside a decrease in buying momentum. This combination often precedes a downward trend as it indicates a shift in trader sentiment from bullish to bearish.
If SHIB cannot hold above its immediate support level, we could see the price slip toward the lower support at $0.00002836, where there may be an opportunity for the bulls to attempt to regain control.
 Dan Burgin
 U.Today Editorial Team