
How is Stellar doing? The world’s 10th largest cryptocurrency has been through bad times: it keeps falling in search of the second bottom, but traders claim that the accumulation phase is almost over. Soon, XLM is expected to surprise us. How exactly? Let’s check Stellar price forecasts from TradingView users.
Pump to $0.15 in June
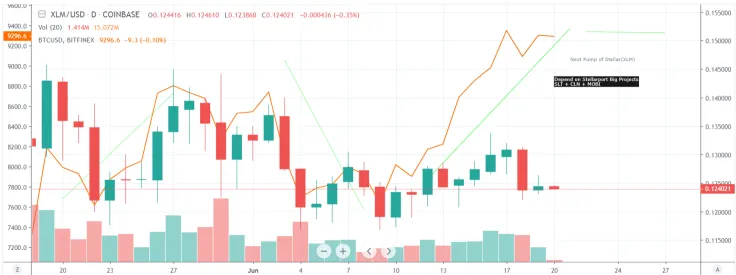
As we know, Stellar depends on banking, and its project focuses on Decentralized Exchange, in which there are some projects (SLT and CLN).
SLT did a great job in the past year, but now it's time for CLN, which is trading at around 0.21 XLM per coin. They are providing a platform to Freelancers. Cryptolancers (CLN) is recently listed on Stellarport, having high volume and best price. All of that has attracted big whales these days to invest in Cryptolancers. So the track of Stellar (XLM) can lead it to $0.15-0.16 in the end of June. So it's better to keep both CLN and Stellar. Why? As the user predicted before, the price of CLN it will be 2 XLM in the upcoming month.
XLM/BTC prepares for amazing longs!
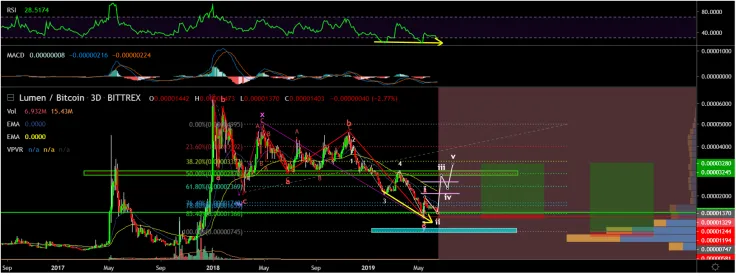
User ChaseWallace predicts a few amazing things for Stellar.
1st amazing buy would be right now with a stop under the bear market low (great risk/reward ratio).
The 2nd amazing buy would be the obvious next one when Stellar starts beating the first resistance lines.
There’s no explanation how this will go and when exactly it happens, but it’s clear that Stellar grants us cool trading opportunities.
The trend is reversing!
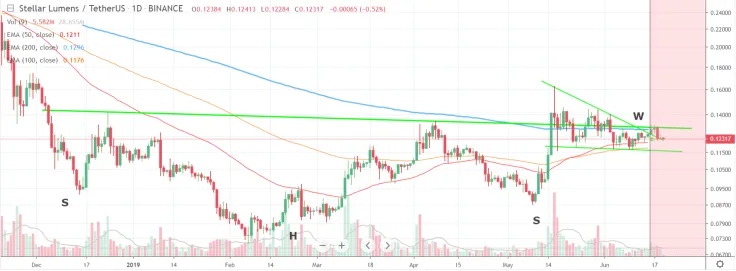
We know that Bottom Head & Shoulders Pattern has recently been formed, and the price failed to stay above the critical resistance levels (H&S neckline and the blue EMA 200). Currently, a potential wedge is forming up, and we should be bullish if the price breaks $0.132 with a final target of $0.19. We should short/stop if the wedge breaks downward.
Bull flag pattern for XLM
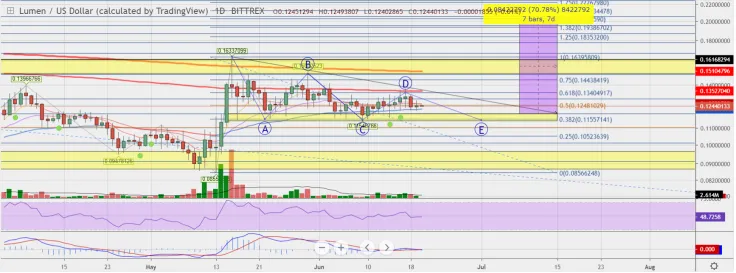
The price chart from YMula provides us with a few trading tips: we should accumulate between $0.12-0.14 and release the sum between $0.18-0.20 to gain profits.
Head & Shoulders pattern – check it out!
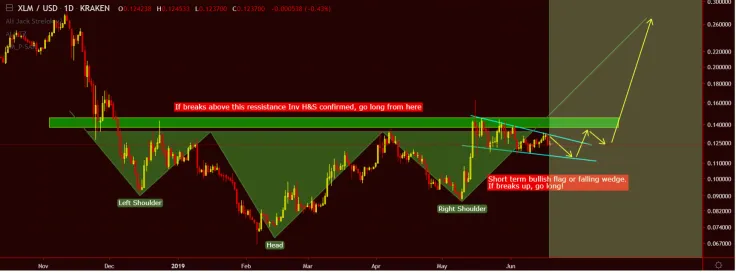
This price chart proves that XLM is ready to go to the Moon! Good time for potential investments: there’s an H&S pattern that has formed. We should go long with pattern confirmation or accumulate before the break out, using stop-loss strategy.
Final thoughts
Now when XLM has broken out of the triangle, it’s expected to move up even despite the recent pessimistic moods on the market. Many crypto experts and amateur users predict that XLM should hit the $0.25 target, thus, growing by 100%. Some traders claim that it should reach the $0.30 threshold in the short term.
The last broken wedge was followed by a strong sell off. Looks like the market needs to reset before rallying, so let’s see if history repeats and Stellar goes through another strong rally again.
As for XLM/BTC pair, we are waiting for a 4H price chart to confirm a bullish SFP, even after a double retest of the 4H pivot. Full confirmation of bullish period will be at 1476 satoshi with high bullish volume off of a bounce from here.
Stellar (XLM) price charts by TradingView
 Alex Dovbnya
 Dan Burgin
 Denys Serhiichuk
 Gamza Khanzadaev
 Caroline Amosun