
The crypto rally is over – bulls slam on the brakes, and the prices of all cryptocurrencies are dragged down. Which lowest lows we will observe on this market, and how will altcoins move further? Today, we observe altcoin price predictions for seven top cryptos: LTC, EOS, BCH, BSV, TRX, ADA, XLM. Let’s check out what TradingView experts think about the future of the altcoin market.
Litecoin has no light?
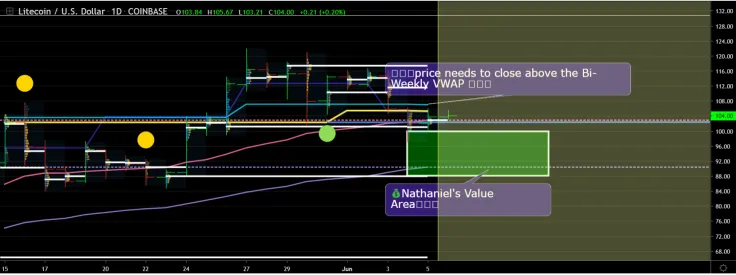
LTC has struggled this week to push back above the weekly VWAP (Dark Blue line) which is a little concerning. With price consolidated around the previous monthly VWAP level (Yellow Line), which is also the current 30-day VWMA and the fact that these levels sit on $100 mean there is no reason to buy LTC at this price, and if we drop below $100, there will be a steep drop towards $90.
With the weekly VWAP in a downtrend this week, there should be off limits to buy LTC until we see a close above the monthly VWAP and price sustains a level above the weekly VWAP. On the opposite spectrum, a close below $100 would be the right place to load up on more LTC for a long term hold. LTC will not end this year below $100, especially with Litecoin halving in two months. Use the value area on the chart as a guide but be careful as the price could be heading towards the three months low, which is the 90-day VWMA (purple line).
EOS: Attention on the pivot point
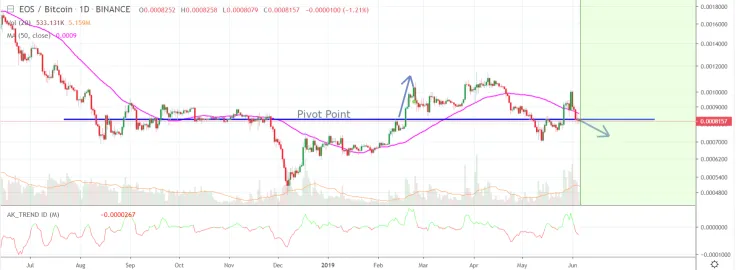
EOS falls on both charts: EOS/USD, and EOS/BTC. The current EOS/BTC price around 0.0008 seems to be an overall pivot point between EOS and Bitcoin. While EOS hopes to be the Everything Operating System, Bitcoin is emerging as a great non-correlated asset and gold replacement. Block.One’s June 1 announcement wasn't great as they announced a super product, voice.com, that won't be available for months. Based on this info, realstep predicts better BTC performance than EOS for the next week or so – it means EOS probably won’t be able to break the pivot point again.
Bitcoin Cash in ABC pattern
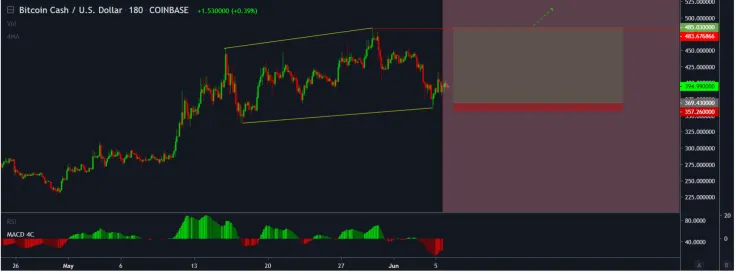
Judging by the BCH price chart by Hyacinth, it's a very possible scenario to see BCH making a new high with ABC pattern, if this complete pattern gets validated (risk is too small as shown). Meanwhile, the downtrend channel opens up new short trading opportunities. You can buy BCH right now, and watch for the key level to sell around $424. If you are patient enough, you can even wait till the end of the year – BCH growth should be wild as always.
BSV will gain momentum by the end of 2019
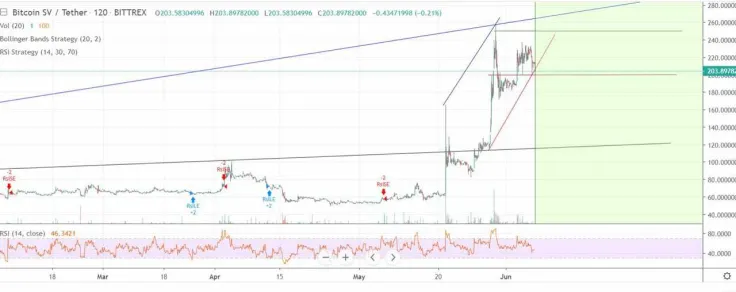
BSV broke free on a bullish run near the end of May and has continued uphill ever since. With this being newer crypto, it is hard to predict a long term future in its current state, although the near-future looks promising. It looks as if BSV has found itself at a new price floor of around $200 and a ceiling of around $250. Since BSV's bull run started, it first broke $100 and corrected itself before purging upward and has since followed the same pattern after breaking $200. It might hint that BSV will remain bullish in the near-future and continue to rise further above the $200 mark.
On the bearish side, BSV seemed to struggle in keeping its momentum when it broke past $250. This breakout was followed by another correction that brought the currency below $200 and later began the bullish trend we are now riding. “Based on the recent trends, I predict that BSV will reach $250 again around mid-June and what happens there will tell a lot about the future of the currency,” – that’s what the user thinks.
Bearish bat on TRX price chart
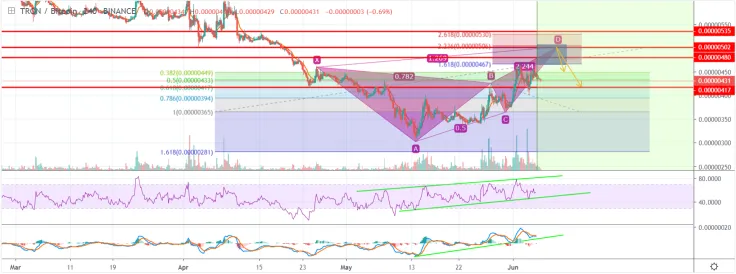
There is a bearish bat pattern on the TRX/BTC when looking at the 4h TF. However looking at the RSI and MACD which look bullish, the long term trend could switch to an uptrend thus only a minor retrace could be expected. Looking at the PRZ and the resistance, a buy-in around the 480 resistance looks good for a TP1 at 450 and a TP2 at 415.
ADA stuck in a triangle
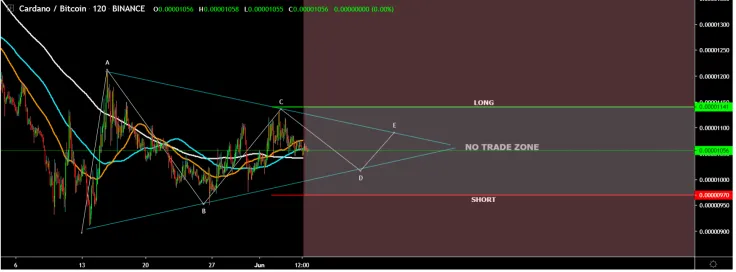
Here’s a simple but informative Cardano price chart from Cryptosuf. We see the Long above green and short below red. Cryptosuf thinks we can see a huge downside if this triangle plays out. But the worst is that we can break up now thus, invalidating that triangle. But if we do finish forming this Triangle, we should fall. Seems like no matter which way ADA chooses, it is doomed to fall.
XLM promises to get to the moon
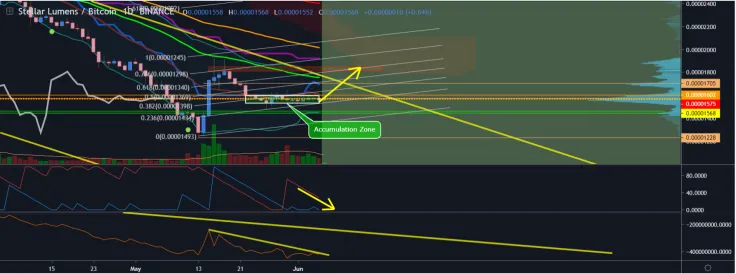
XLM is in the Accumulation Zone (Green Rectangle) between 1500-1600. Bears are still trying to make it down to buy cheaper, but it looks like XLM does not want to go further down.
The airdrop is over. Now XLM is just consolidating for the next push up. The next break up to 1900ish will be a strong reversal sign because we will break out a long Downtrend. If it goes down, it can back to 1500ish but we are already very down, so if you are not a scalper, there’s nothing to fear. Also, don't forget that Stellar had a very different trend than BTC in 2018-2019.
Final words
The crypto market is going through the retracement & accumulation phase – it’s normal. The good news is that most of the altcoins won’t get as low as in early 2019 – many of them will lose up to 50% of the recent higher highs. Use the bearish period to add up to your portfolio, and be patient – the bearish period may last till the end of the year. Meanwhile, you can try playing on shorts – this is what advanced traders will do.
Price charts by TradingView



 Vladislav Sopov
 Dan Burgin