Disclaimer: The opinions expressed by our writers are their own and do not represent the views of U.Today. The financial and market information provided on U.Today is intended for informational purposes only. U.Today is not liable for any financial losses incurred while trading cryptocurrencies. Conduct your own research by contacting financial experts before making any investment decisions. We believe that all content is accurate as of the date of publication, but certain offers mentioned may no longer be available.
XRP has recently confronted significant market pressure, posing the question: Can it withstand the current challenges at the 200-day EMA level, which is the strongest support for the asset for now? A technical breakdown from a descending triangle pattern has heightened concerns among investors, with XRP breaching critical technical support levels.
XRP's descent from the consolidation pattern typically indicates bearish sentiment among traders, with the potential for further declines. However, the 200 EMA has historically acted as a robust support line for many assets, including XRP. Currently, XRP is testing this crucial level, which could potentially serve as a springboard for a price reversal if sufficient buying pressure emerges.
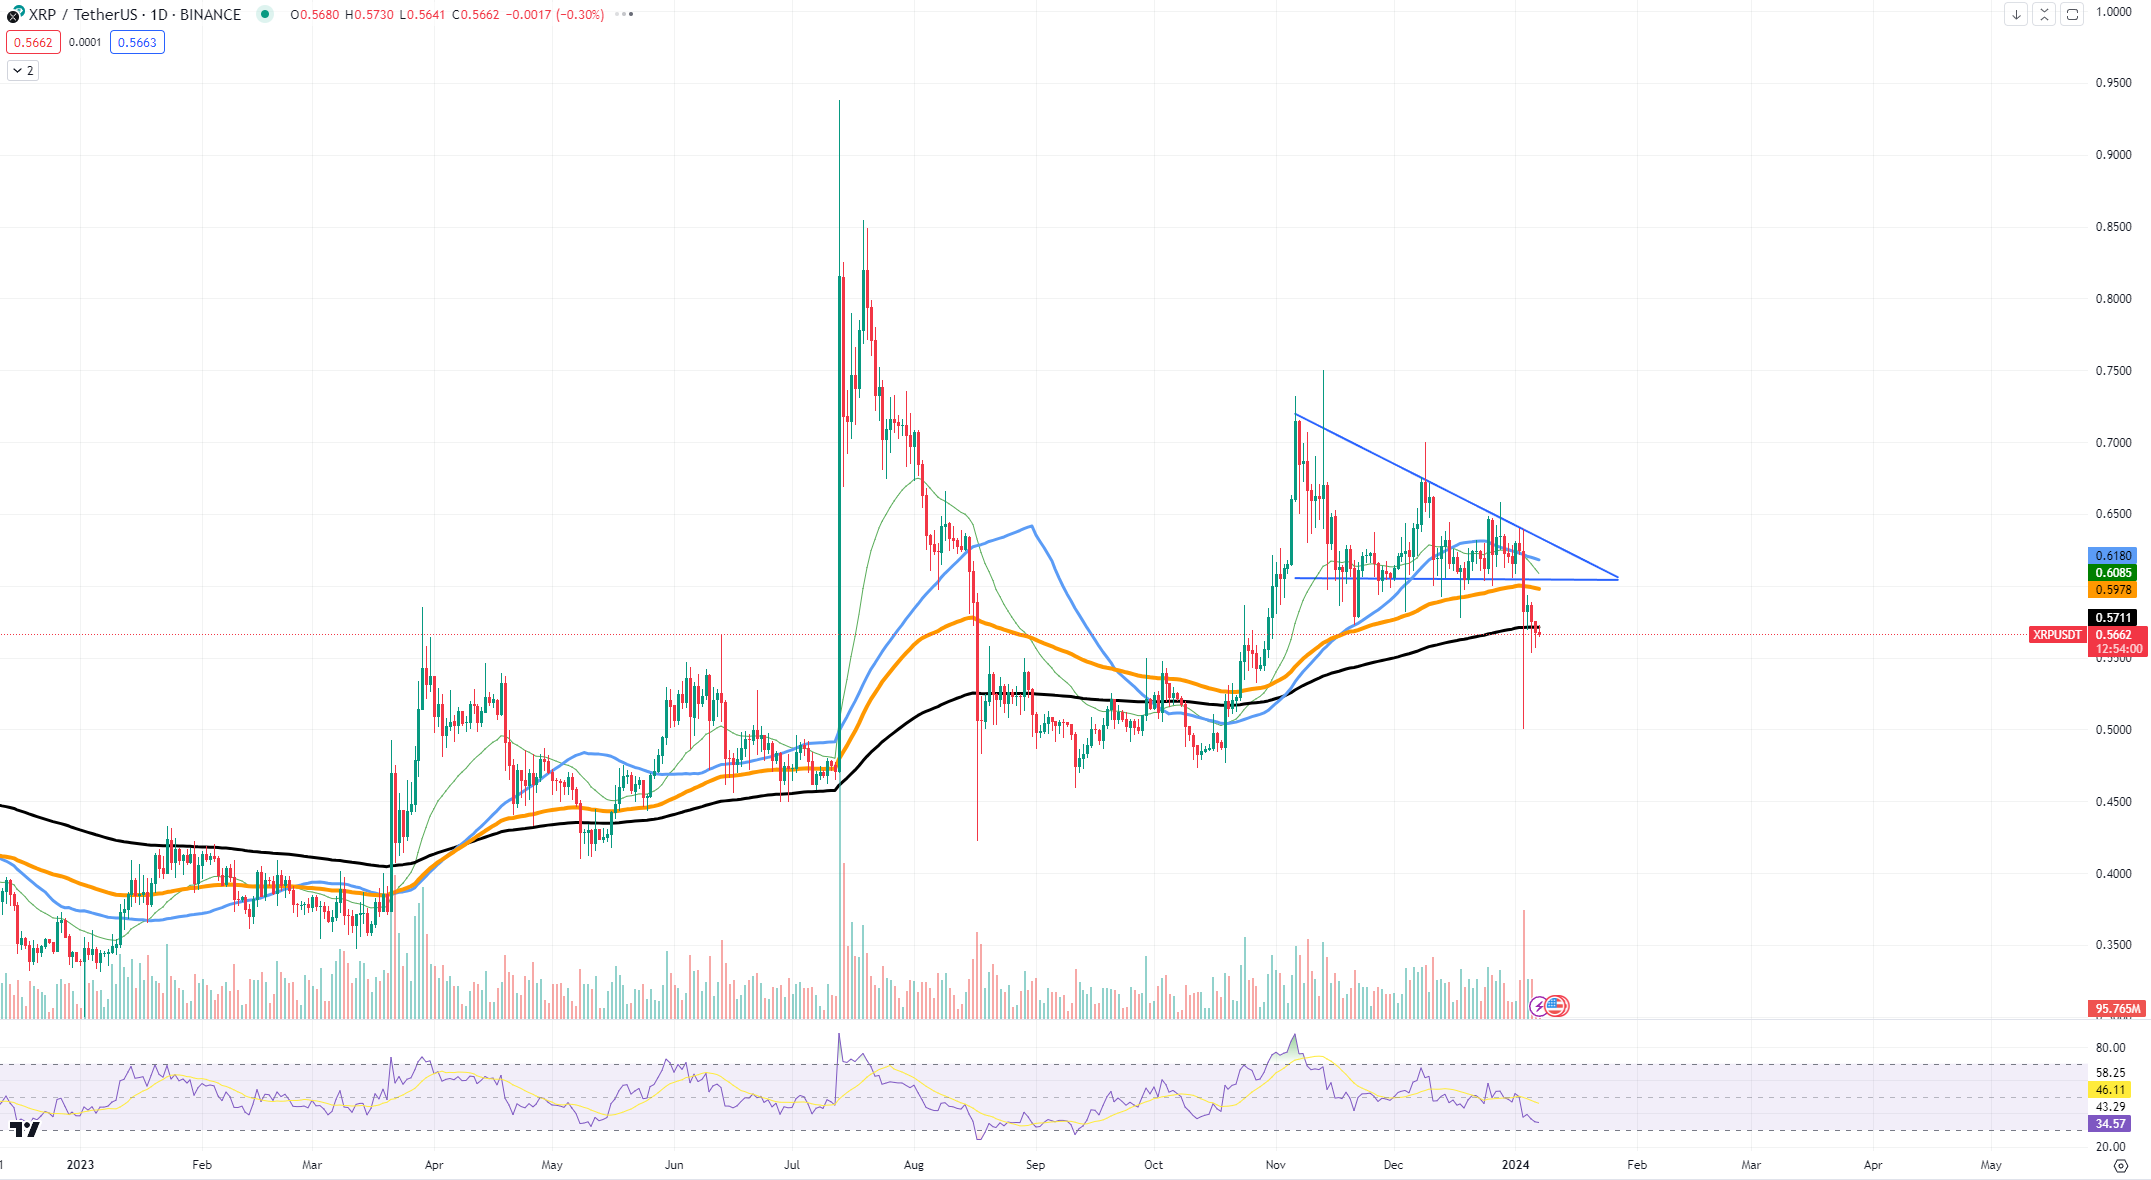
The volume profile, which shows trading activity over a specified time at certain price levels, can provide insights into potential support and resistance zones. For XRP, a significant volume node around the current price level suggests that it was previously an area of substantial trading activity, which may now act as a support region.
Compellingly, the relative strength index is hovering in low territory. This could signal that XRP is oversold and may be primed for a reversal if the market sentiment shifts, as low RSI levels can sometimes precede a turnaround in price action.
Another crucial factor to consider is the psychological support level at around $0.5. Psychological support levels are price points at which an asset often finds support due to common human behavior and psychological response to round numbers. If XRP breaks below the 200 EMA, this $0.5 level may be the next test of investor resolve.
Solana's reversal is close
Solana is showing signs that it could be on the cusp of a price reversal. Technical analysis of the SOL/USDT trading pair indicates the potential for upcoming growth, despite a recent period of consolidation and scam-related setbacks within the ecosystem.
After a vigorous uptrend, Solana's price action has entered a cooling-off phase, with the ecosystem not witnessing any major releases lately. The price has settled on the 26-day exponential moving average. Historically, the 26 EMA has served as a dynamic level from which price could bounce after a retracement, suggesting that SOL may be poised for an upturn.
The local support level for Solana has formed around $93, which aligns with the 26 EMA. This could be an area of interest where buyers might reenter, viewing the price as attractive and potentially driving up demand. On the flip side, the immediate resistance level to watch is near the $105 mark, which has previously acted as both support and resistance in different phases of the market cycle.

A point of consideration is the recent spate of scams within the Solana ecosystem, which some analysts believe could signal a market top and a subsequent reversal. However, such events tend to shake out weak hands and might consolidate holdings among more steadfast investors, setting the stage for a rally when market sentiment shifts.
Looking at the RSI, Solana is neither in the overbought nor oversold territory, suggesting that there is room for movement in either direction. However, the convergence of the RSI toward the median line, coupled with price support at the 26 EMA, leans toward the potential for a bullish scenario.
In terms of probability, the confluence of these technical indicators — the 26 EMA support level and a neutral RSI — combined with the psychological aspect of recent scam-related capitulations, may tilt the scales in favor of a positive price reversal in the foreseeable future.
It would be wise to keep a close eye on the aforementioned support and resistance levels, as a decisive break beyond these could confirm the market's direction. While the current calm in the Solana ecosystem might not suggest immediate growth, the technical structure on the chart lays the groundwork for a potential change in trend.
 Dan Burgin
 U.Today Editorial Team